At a Glance:
- The blog aims to demystify the process of coupling HashiCorp Consul, a widely adopted service mesh, with FluxNinja Aperture, a platform specializing in observability-driven load management.
- HashiCorp Consul and FluxNinja Aperture's technical teams collaborated to enable seamless integration. This is facilitated through the Consul’s Envoy extension system, leveraging features like external authorization and OpenTelemetry Access logging.
- By integrating these two platforms, the service reliability and performance of networked applications can be significantly improved. The synergy offers adaptive rate-limiting, workload prioritization, global quota management, and real-time monitoring, turning a previously manual siloed process of traffic adjustments into an automated, real-time operation.
In the dynamic world of software, modern applications are undergoing constant transformation, breaking down into smaller, nimble units. This metamorphosis accelerates both development and deployment, a boon for businesses eager to innovate. Yet, this evolution isn't without its challenges. Think of hurdles like service discovery, ensuring secure inter-service communication, achieving clear observability, and the intricacies of network automation. That's where HashiCorp Consul comes into play.
In this blog, we'll dive deep into modern load management techniques for service-oriented architecture, along with understanding how the Consul and FluxNinja integration can help improve the reliability posture of applications. Lastly, we will discuss how it works and how to integrate.
Service Meshes: The Fabric of Communication and Beyond
HashiCorp Consul is a service networking solution empowering teams to establish secure network connectivity between services spanning on-premise infrastructures and multi-cloud environments. Beyond connectivity, Consul offers a suite of features, including service discovery, service mesh, traffic management, and network infrastructure automation.
Service meshes, while fundamentally designed to bolster secure and observable inter-service communication, have the potential to offer even more. Positioned uniquely within the application stack, they possess the capability to enhance application reliability. This enhancement is especially notable through advanced load management techniques. These techniques leverage a variety of application health signals, and these signals might include database metrics like connection counts and transaction statuses, or other indicators such as increased response times, high CPU usage during query executions, and replication delays. They could also extend to wider infrastructure signals or service metrics encompassing but not restricted to 'golden signals' such as latency, CPU usage, and memory consumption.
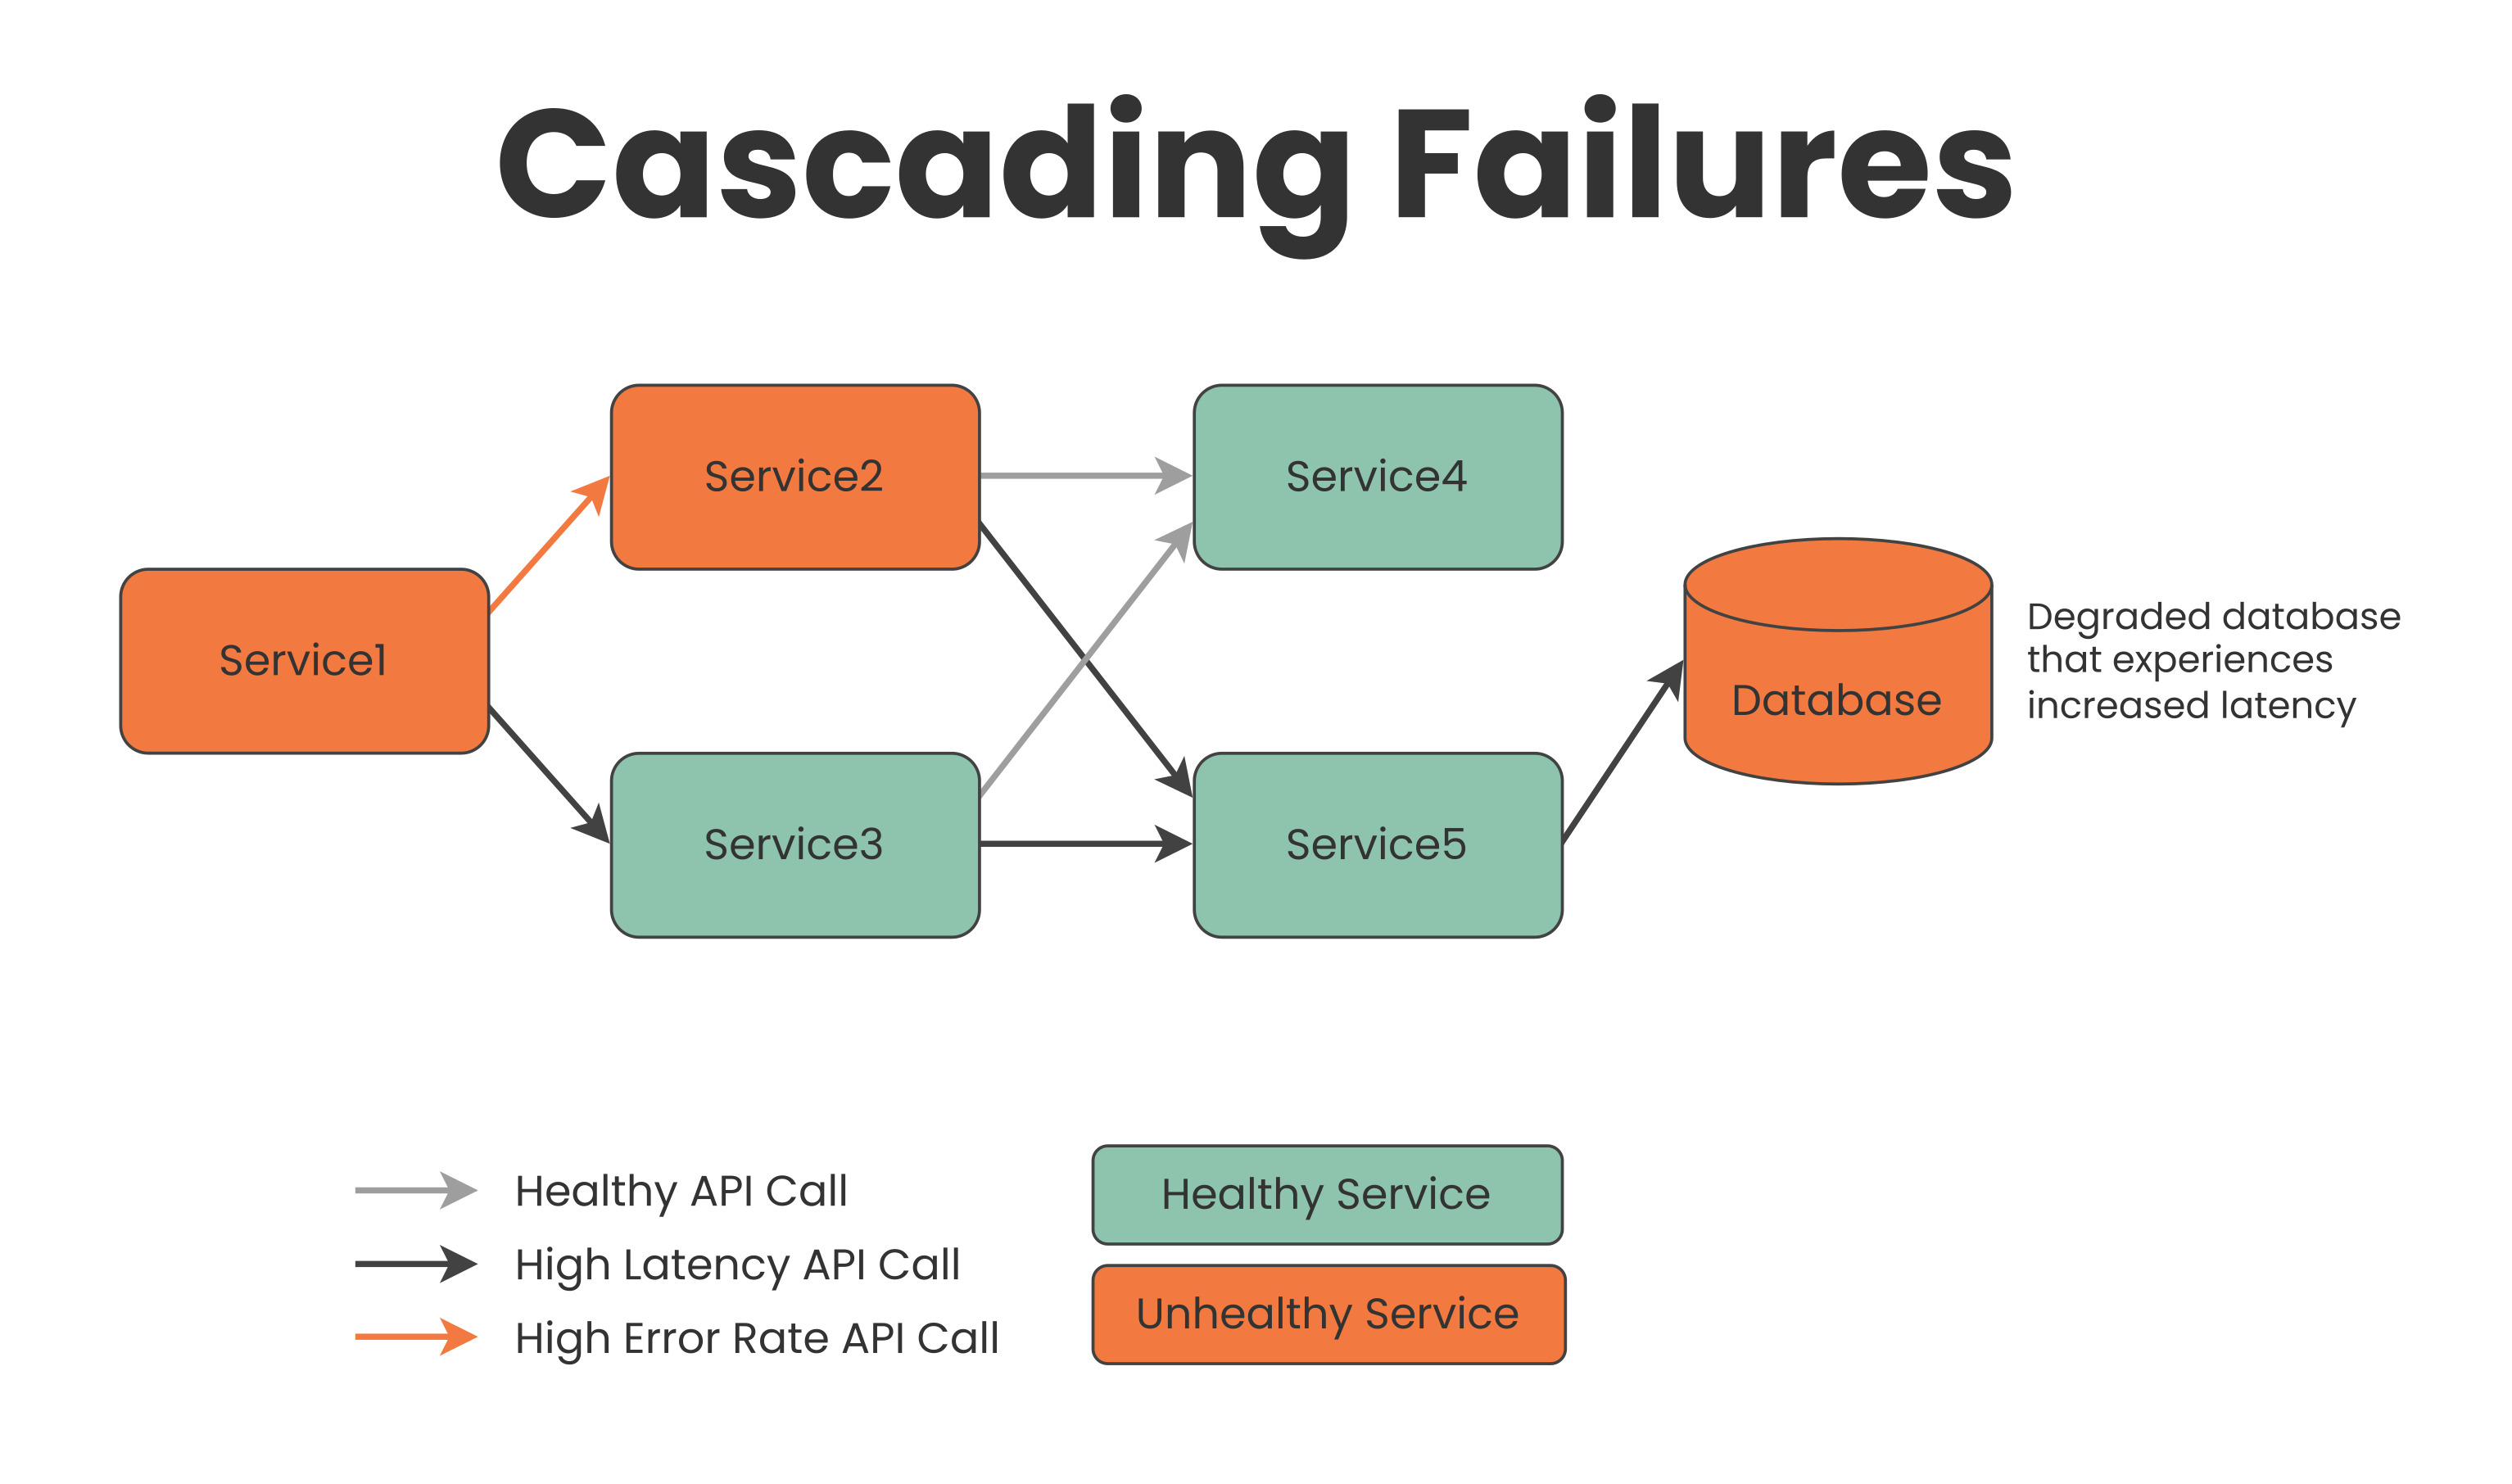
To illustrate in Fig.1, in a service-oriented architecture, a single service call ,might branch out to multiple upstream services, with several of these services potentially querying a database. Should this database suffer performance degradation—be it from excessive load, a problematic rollout, or other unforeseen issues—the ensuing requests might timeout. Often, service owners introduce a retry mechanism as a contingency for these timeouts. However, this can inadvertently intensify the strain on the system, creating a vicious cycle of retries. To mitigate such scenarios, load management strategies can step in. These strategies can shed excess load or prioritize incoming requests by analyzing database metrics, ensuring optimal performance and stability. This approach was put to the test with PostgreSQL, providing invaluable insights and solutions.
 Figure 1
As the global landscape progressively leans into AI, we foresee a similar set of challenges on the horizon. Similar issues are predicted to arise with Vector databases, such as Chroma. Moreover, as AI platforms increasingly turn to solutions like ChatGPT, which have inherent constraints, the need for dynamic load management strategies will only become more pronounced.
Observability-Driven Load Management
Observability-driven load management goes beyond traditional load management. On a high level, you’re taking signals from one service to take action on the most downstream service, making continuous adjustments to ensure stable behavior without manual intervention, and using the right strategy.
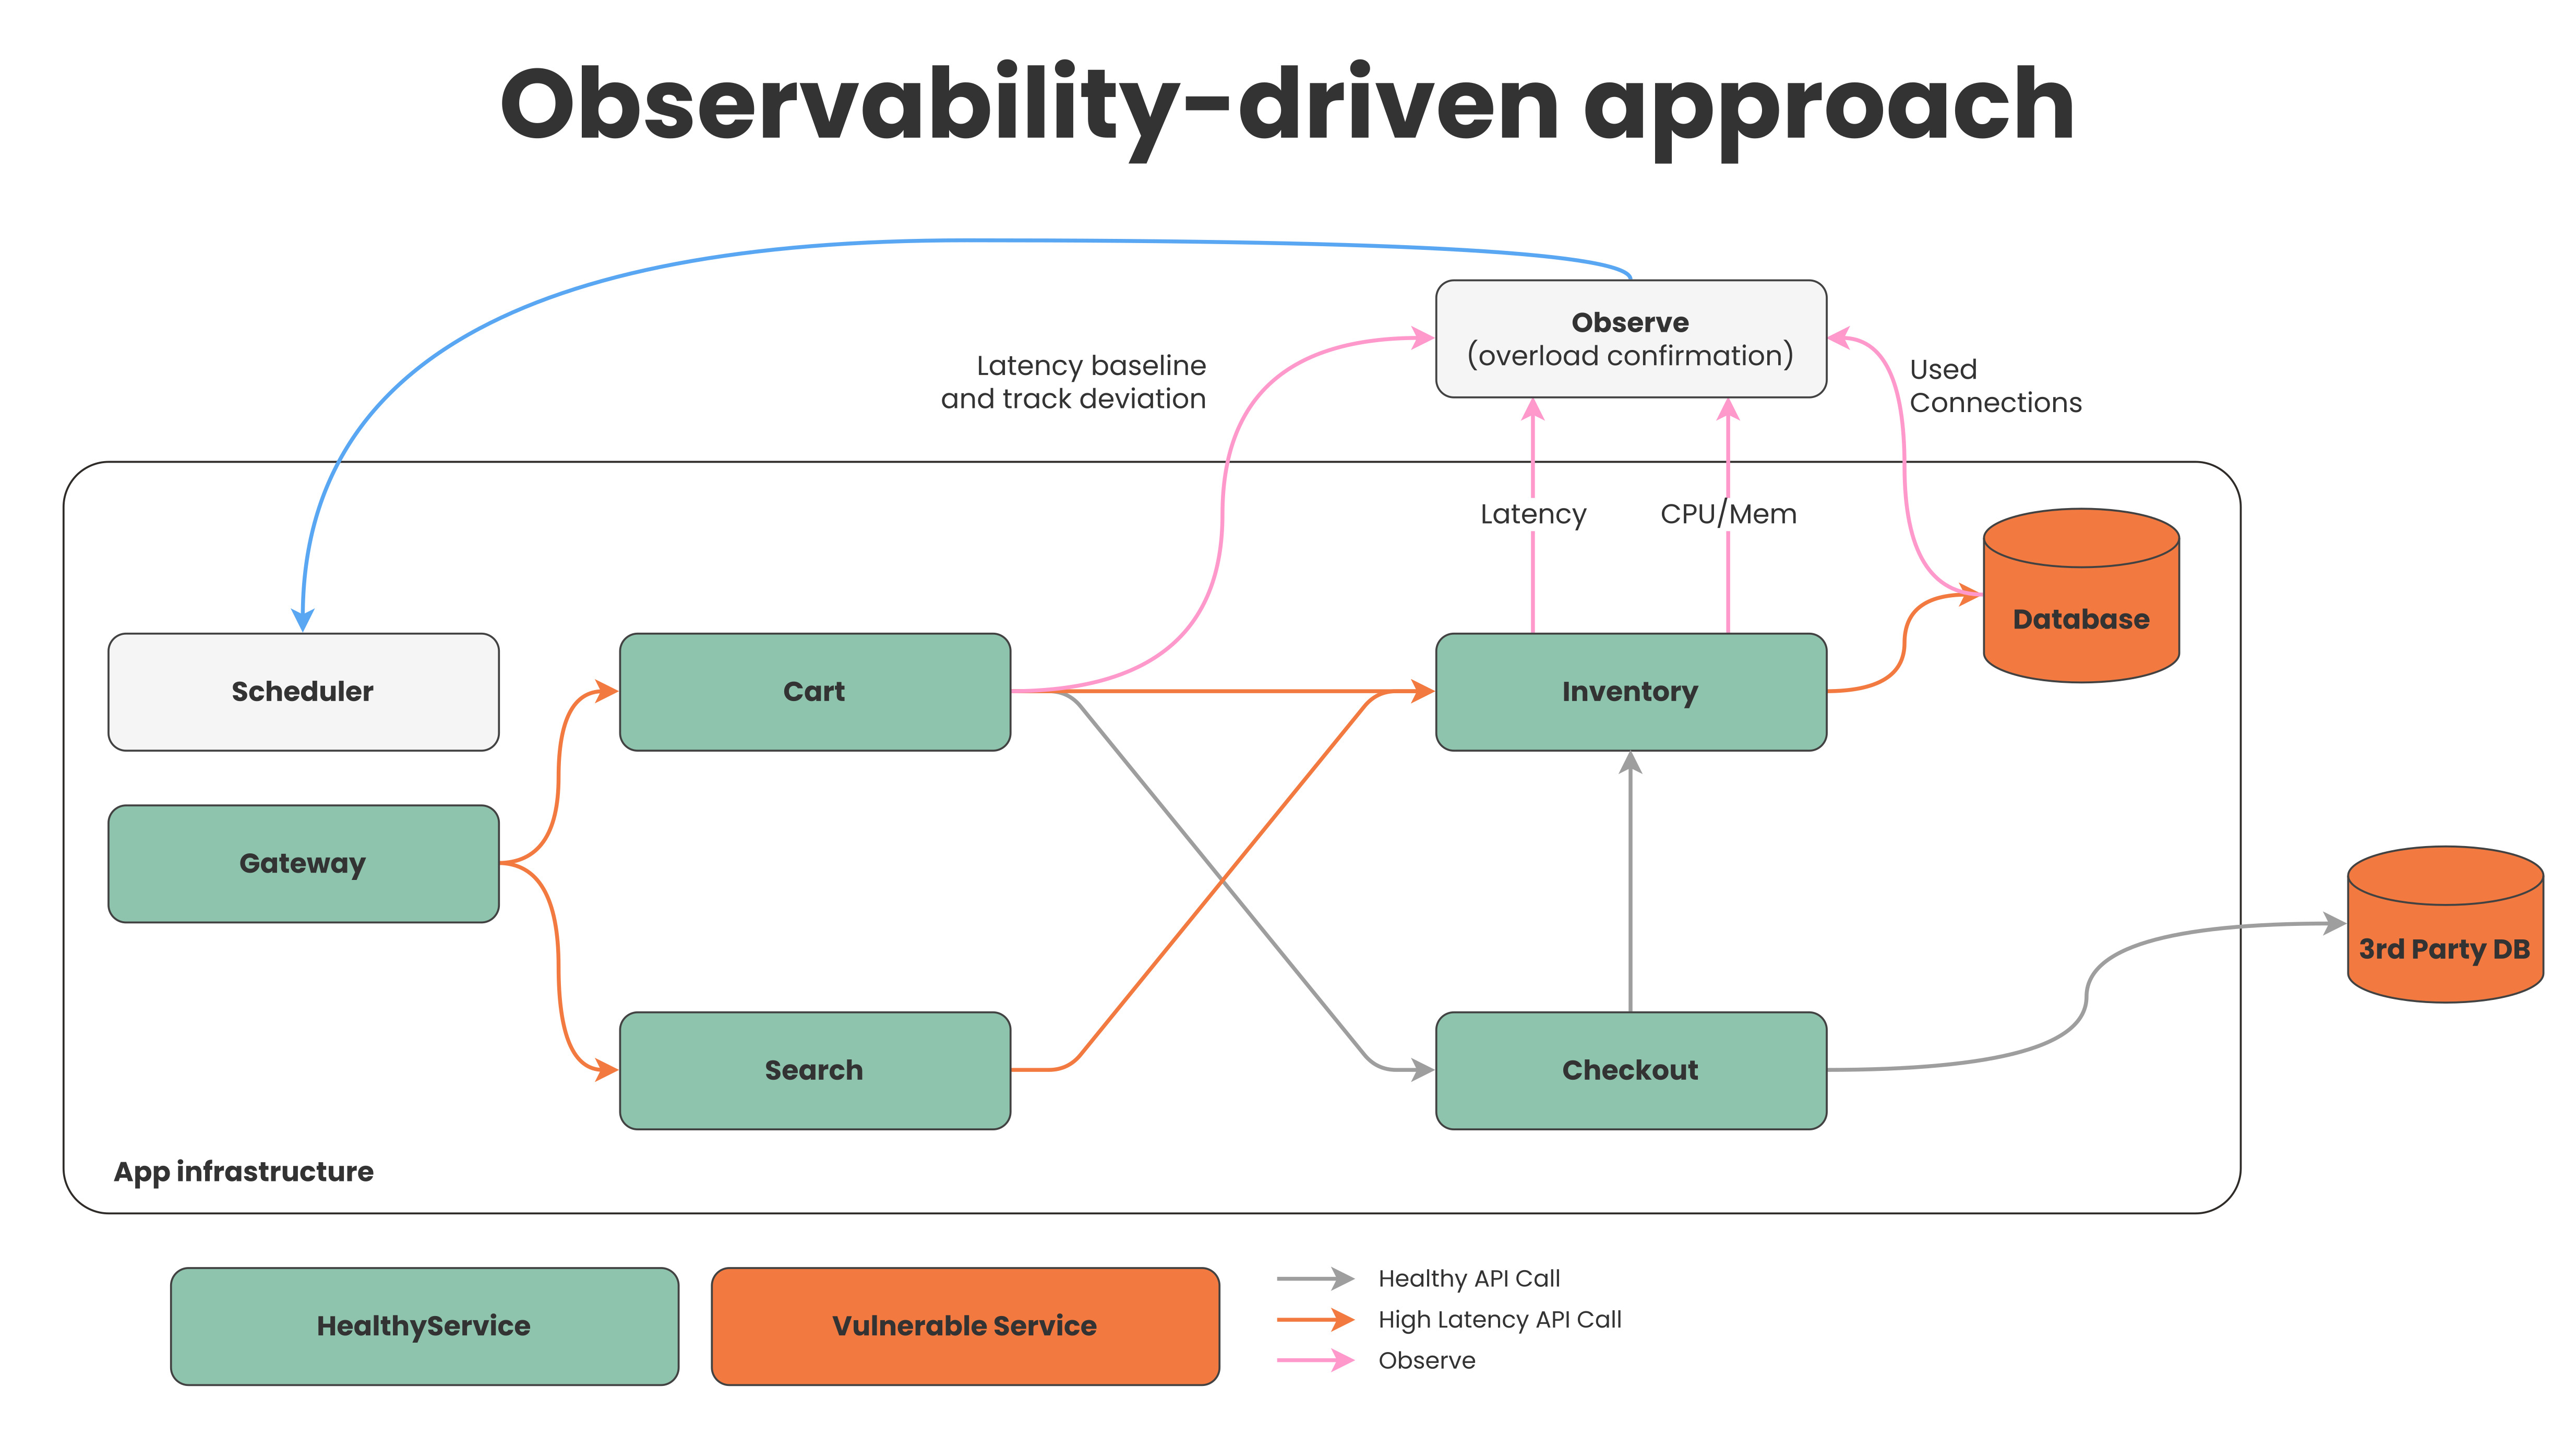
It is easier to understand from a real-world situation like wildfire, where the forestry department employs countermeasures to prevent wildfires from spreading, such as limiting wildfire fuel. However, to employ countermeasures, we need to know where to implement them. We can't put out the wildfire unless we observe the wildfire's direction and where to act. This is what observability-driven load management helps us achieve, providing a signal to act proactively.
 Figure 2
Fig 2, illustrates coordinated control: Adaptively load shedding API calls at the gateway based on database health signals.
Nowadays, where many teams are working on different services, an SRE is required for debugging on-call issues, and so are the infrastructure owners and other teams. Having load management for service-oriented architecture is becoming vital. Load management gives these teams some automated breathing space by de-escalating a potential cascading failure to a graceful degradation of services.
Introducing FluxNinja Aperture
This is where FluxNinja Aperture comes in. It is an observability-driven load management platform, solving reliability with controllability. FluxNinja Aperture provides a centralized control plane that bridges the gap between observability and controllability, allowing us to achieve more out-of-typical service observability.
FluxNinja Aperture can act on any health signal, whether it be queue size, maximum connections, latency, or any other possible signal coming from infrastructure, service, or message queues, and more, to adjust and prioritize the traffic. For example, it can take a congestion signal from the database and use that to throttle traffic.
🌟 Why Should the Aperture Platform be on Your Radar?
- Protect against API abuse: Aperture doesn't merely adjust request rates according to the database's health. It is adept at identifying and mitigating overwhelming read / write operations reminiscent of the challenges APIs face with excessive requests. These disruptions could happen from unintentional surges or deliberate service attacks, but by leveraging real-time signals from databases and cross-referencing with other service degradation indicators, Aperture deploys adaptive rate limits on upstream services. The end result? A database that is capable of handling various loads without any performance degradation.
- Workload Prioritization, Fair Usage, and Avoiding the Noisy Neighbor Problem: In shared database scenarios, it's common for certain users or applications to unintentionally hog all resources, leading to the "noisy neighbor" problem that affects the user's experience. Aperture solves this by workload prioritization and fair resource allocation. Ensuring that every user and application, regardless of their demand magnitude, has a seamless experience without disruptive overlaps.
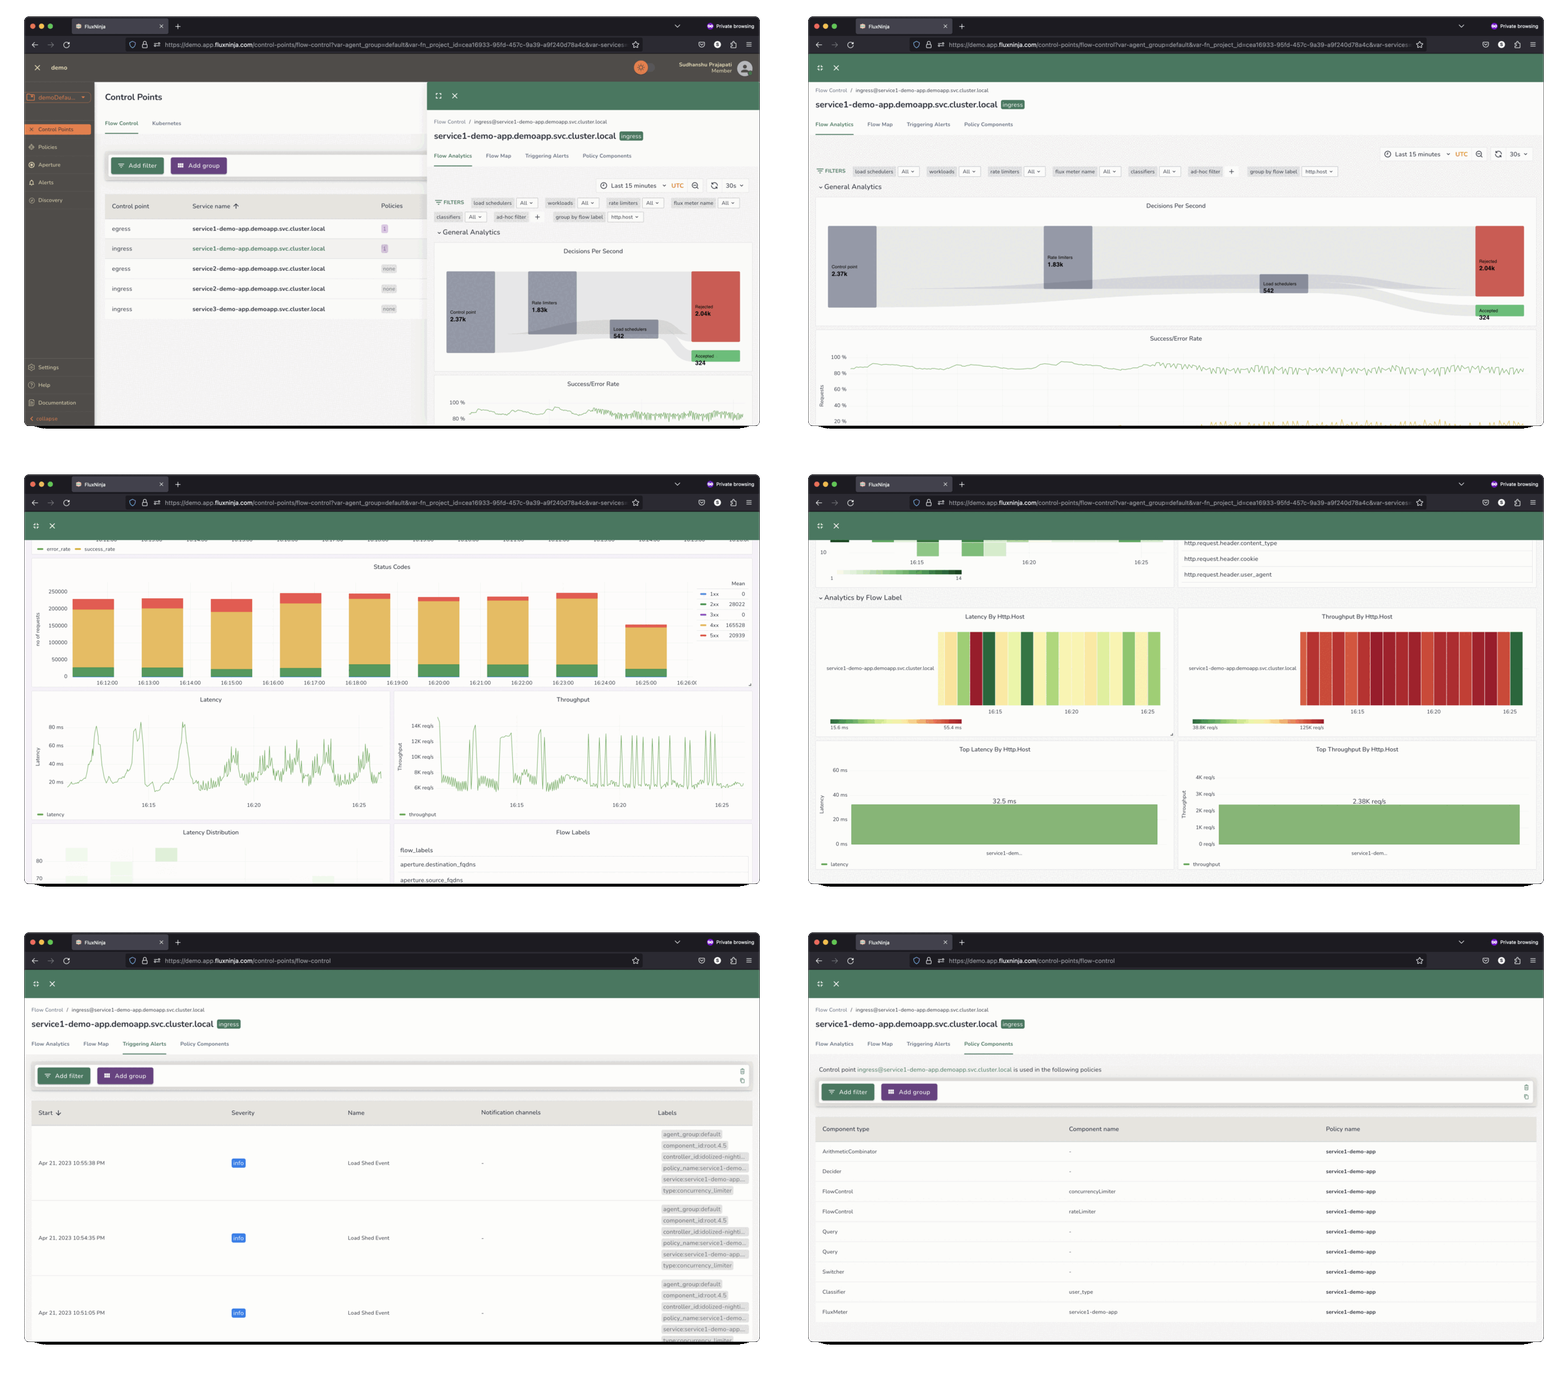
- Infrastructure Load Management: With Aperture Cloud's sophisticated dashboard, real-time insights into system performance are at your fingertips. Flow Analytics can help you understand your traffic and set up the right policies. This way, you know what's happening and can make data backed decisions about managing loads.
 Aperture Cloud provides in-depth insights into the traffic patterns to help
tailor policies that prioritize critical requests.
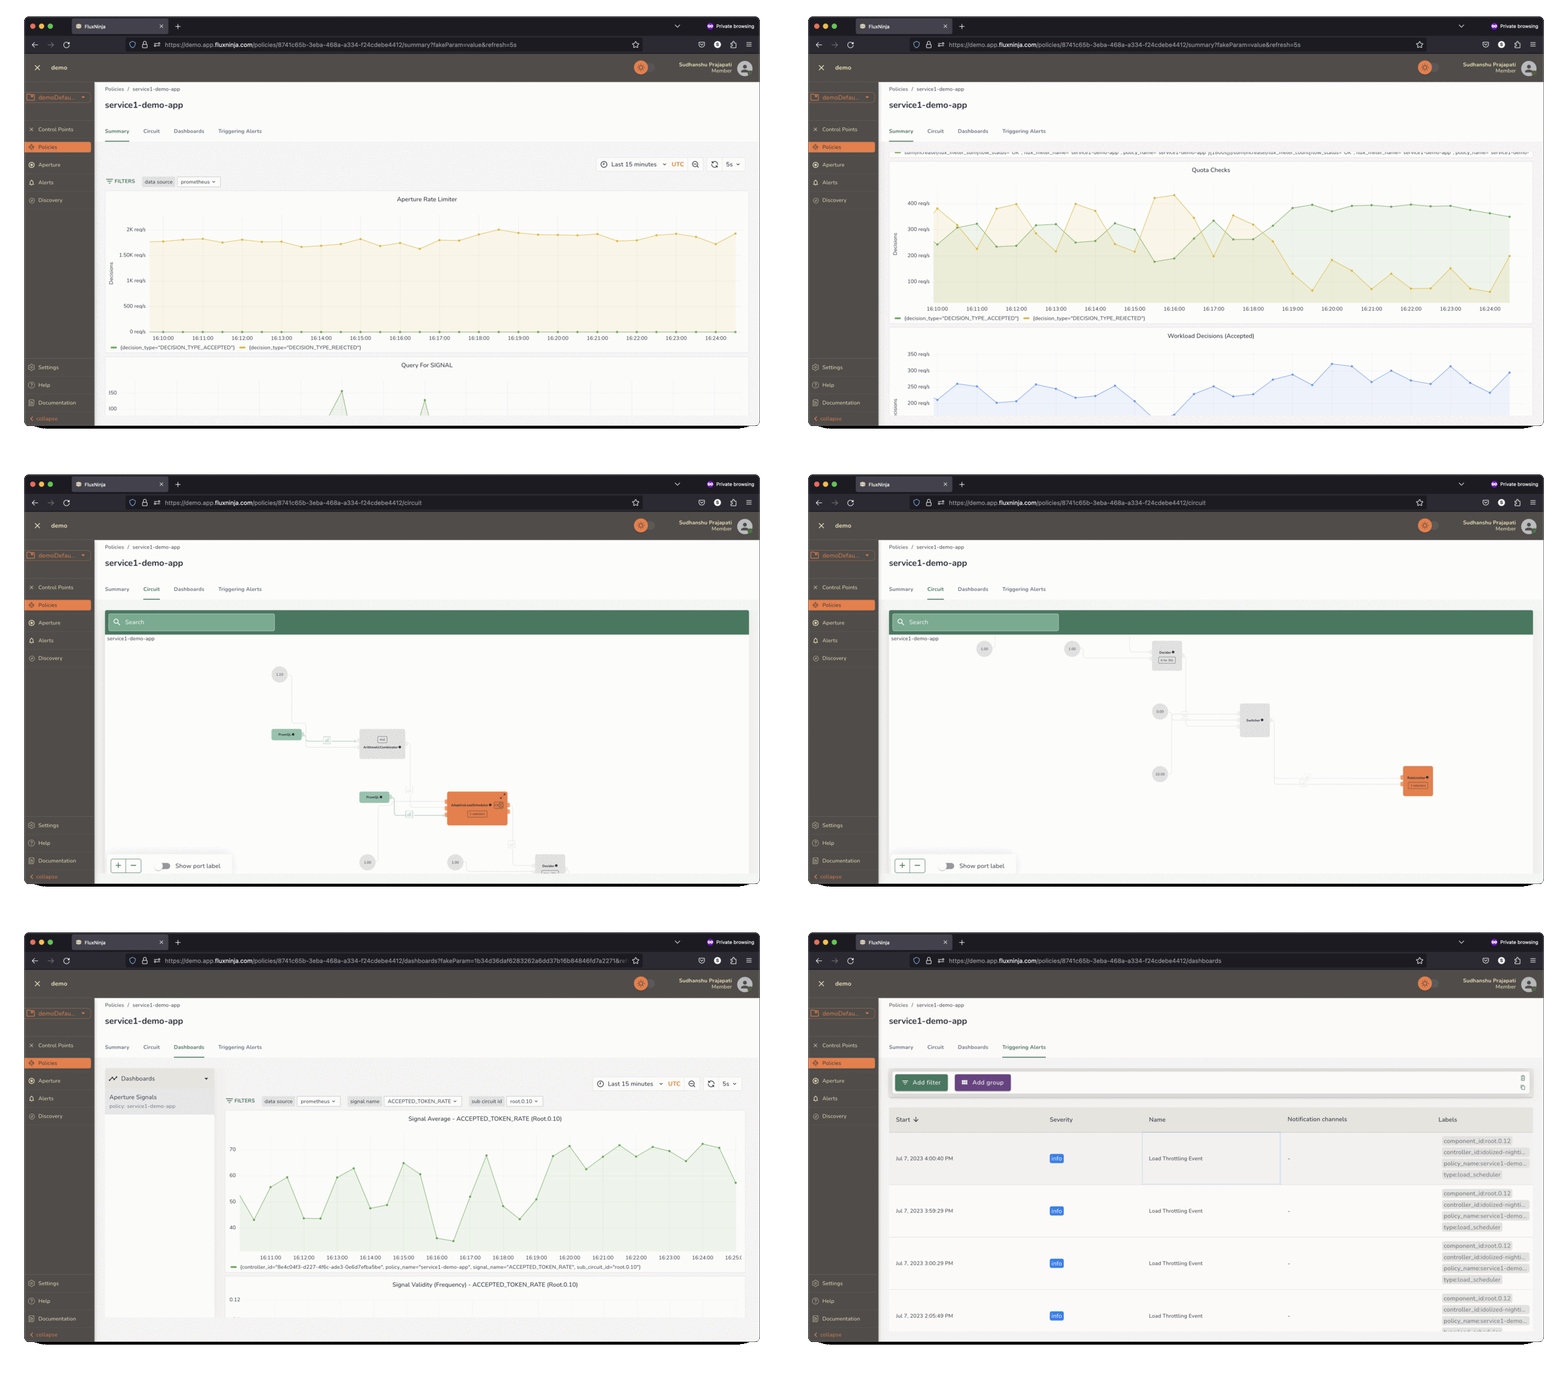
 Aperture Cloud actively monitors and visualizes control policies, providing
real-time explanations for actions taken from health signals.
Upon embracing Aperture Cloud's multifaceted capabilities, we are confident you'll discern its game-changing potential in enhancing your database's efficiency and steadfastness.
Synergy of FluxNinja Aperture and HashiCorp Consul
When you pair FluxNinja Aperture's mastery with HashiCorp Consul’s capabilities, you’re setting the stage for a seismic shift in application reliability and performance. By utilizing Consul's Envoy extension capability and coupling it with Aperture's load management techniques, it is easier to bring forward robust load management with effective service networking.
Aperture brings closed-loop control in traffic management to Consul. In essence, Aperture empowers Consul making real-time adjustments based on observed metrics and signals, significantly improving the reliability posture of the applications.
Let’s learn about the benefits this integration translates to both FluxNinja Aperture and Consul.
Diving Deeper: The Benefits
Consul provides an array of essential features, including service networking, discovery, robust security, and observability. Its role in establishing and maintaining a well-connected application ecosystem is paramount, but this integration opens doors to add observability-driven load management based on real-time metrics and signals.
This expansion introduces new capabilities to HashiCorp Consul, and the below actions can be taken based on any signal being observed within an application, such as:
Not just that, FluxNinja Aperture Cloud brings advanced traffic analytics and alerting. Learn more about the benefits of Aperture Cloud.

Aperture Cloud provides in-depth insights into traffic patterns to help tailor policies.
How Does It Work?
The Consul Envoy extension system allows modification of Consul generated Envoy resources without customizing the Consul binary, enabling additional Envoy features for service mesh traffic that passes through an Envoy proxy. You can learn more about Envoy Extension and supported extensionshere.
Using that extension system, FluxNinja Aperture integrates using two extensions:External Authorization and OpenTelemetry Access logging.
External Authorization Extension
This allows the configuration of External Authorization filters for the Envoy proxy so that it can route requests to Aperture, which acts as an External Authorization System. Each request is authorized by Aperture, which makes access control decisions based on the metadata extracted from the requests before forwarding them to the actual service.
OpenTelemetry Access Logging
Access logs are used to understand the incoming traffic patterns to the proxy.
Consul added the support for Envoy access logging a while back, which enabled
output logs to stdout pipe or a file. However, for Aperture to work, it needed
OpenTelemetry Access logging Envoy extension support, which the FluxNinja team
contributed back to Consul.
These Access logs capture metadata about each request, such as the request method, path, headers, response status code, request duration, and so on., which can be used to optimize application performance and reliability. By analyzing traffic patterns and identifying potential issues or performance bottlenecks, service owners can make informed decisions to improve their applications.
For help with integration, you can reach the FluxNinja Support Team at support@fluxninja.com.
Conclusion
To sum it up, combining HashiCorp Consul's service networking with FluxNinja Aperture's load management offers a strong solution for better app performance and reliability. The integration of FluxNinja Aperture with HashiCorp Consul isn't just a technological feat—it's the future. As applications become more intricate and demand more multifaceted, this partnership promises to be the beacon leading the way.
We invite you to sign up for Aperture Cloud (Use the 30-day free trial coupon: FLUXNINJA30DAYS.) and try out the HashiCorp Consul integration, which will equip you with robust traffic analytics, alerts, and policy management.


