

Service meshes are becoming increasingly popular in cloud-native applications, as they provide a way to manage network traffic between microservices. Istio, one of the most popular service meshes, uses Envoy as its data plane. However, to maintain the stability and reliability of modern web-scale applications, organizations need more advanced load management capabilities. This is where Aperture comes in, offering several features, including:
- Service Load Management: Dynamically adjusts the number of requests that can be made to a service based on its health. It can also prioritize requests based on their importance, ensuring that critical requests are processed first.
- API Quota Management: Optimizes external API requests by managing quotas across multiple services preventing overages.
- Rate Limiting: Prevents abuse and protects the service from excessive requests.
These capabilities help manage network traffic in a microservices' architecture, prioritize critical requests, and ensure reliable operations at scale. Furthermore, integrating Istio for flow control is seamless, requiring no alterations to your existing application code.
In this blog post, we will dive deeper into what a Service Mesh is, the role of Istio and Envoy, and how they work together to provide traffic management capabilities. Finally, we will show you how to manage loads with Aperture in an Istio configured environment.
What is a Service Mesh?
Since the advent of microservices architecture, managing and securing service-to-service communication has been a significant challenge. As the number of microservices grows, the complexity of managing and securing the communication between them increases. Recently, a new approach has emerged that aims to address these challenges: the service mesh.
The concept of a service mesh was first introduced in 2016, when a team of engineers from Buoyant, a startup focused on cloud-native infrastructure, released Linkerd, an open source service mesh for cloud-native applications. Linkerd was designed to be lightweight and unobtrusive, providing a way to manage service-to-service communication without requiring significant changes to the application code.
Istio as a Service Mesh
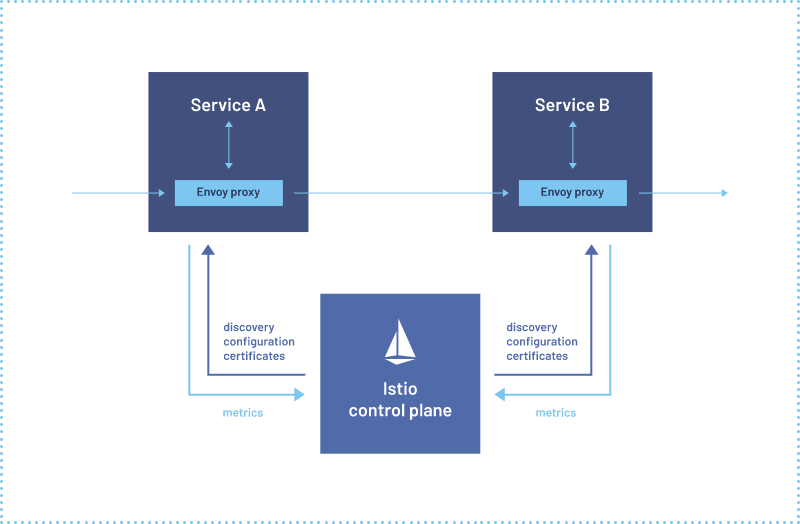
Source: Istio
Istio is an open source service mesh that is designed to manage and secure communication between microservices in cloud-native applications. It provides a number of features for managing and securing service-to-service communication, including traffic management, security, and observability.
At its core, Istio works by deploying a sidecar proxy alongside each service instance. This proxy intercepts all incoming and outgoing traffic for the service, and provides several capabilities including traffic routing, load balancing, service discovery, security, and observability.
When a service sends a request to another service, the request is intercepted by the sidecar proxy, which then applies a set of policies and rules that are defined in Istio's configuration. These policies and rules dictate how traffic should be routed, how load should be balanced, and how security should be enforced.
For example, Istio can be used to implement traffic routing rules based on request headers, such as routing requests from a specific client to a specific service instance. Istio can also be used to apply circuit-breaking and rate-limiting policies to ensure that a single misbehaving service does not overwhelm the entire system.
Istio also provides strong security capabilities, including mutual TLS authentication between services, encryption of traffic between services, and fine-grained access control policies that can be used to restrict access to services based on user identity, IP address, or other factors.
What is Envoy?
Envoy is an open source, high-performance edge and service proxy developed by Lyft. It was created to address the challenges of modern service architectures, such as microservices, cloud-native computing, and containerization.
Envoy provides several features for managing and securing network traffic between services, including traffic routing, load balancing, service discovery, health checks, and more. Envoy is designed to be a universal data plane that can be used with a wide variety of service meshes and API gateways, and it can be deployed as a sidecar proxy alongside service instances.
One of the key benefits of Envoy is its high-performance architecture, which makes it well-suited for managing large volumes of network traffic in distributed systems. Envoy uses a multithreaded, event-driven architecture that can handle tens of thousands of connections per host, with low latency and high throughput.
Traffic Management in Istio
Istio's traffic management capabilities enable the control of network traffic flow between microservices. This refers to the ability to manage how the traffic flows between them.
In Istio, traffic management is primarily done through the use of Envoy sidecar proxies that are deployed alongside your microservices. Envoy proxies are responsible for handling incoming and outgoing network traffic and can perform a variety of functions such as load balancing, routing, and security.
Let's talk about EnvoyFilter and how it is used in Aperture.
Aperture's EnvoyFilter
One way to customize the behavior of Envoy proxies in Istio is through the use of Envoy filters. Envoy filters are a powerful feature of Envoy that allow you to modify, route, or end network traffic based on various conditions such as HTTP headers, request/response bodies, or connection metadata.
In Istio, Envoy filters can be added to your Envoy sidecar proxies by creating custom EnvoyFilter resources in Kubernetes. These resources define the filter configuration, the filter type, and the filter order, among other parameters.
There are several types of filters that can be used in Istio, including HTTP filters, network filters, and access log filters. Here are some of the Envoy filters that Apertures uses.
- HTTP filters: You can use HTTP filters to modify or route HTTP traffic based on specific criteria. For example, you can add an HTTP filter to strip or add headers, modify request/response bodies, or route traffic to different services based on HTTP headers or query parameters.
- Network filters: You can use network filters to modify network traffic at the transport layer, such as TCP or UDP. For example, you can use a network filter to add or remove SSL/TLS encryption or to redirect traffic to a different IP address.
Filters are loaded dynamically into Envoy and can be applied globally to all traffic passing through the proxy or selectively to specific services or routes.
Aperture uses EnvoyFilter to implement its flow control capabilities. The Aperture Agent is integrated with Envoy using EnvoyFilter, which allows the agent to use the External authorization API (we will learn more about this in the next section). This API allows Aperture to extract metadata from requests and makes flow control decisions based on that metadata. With EnvoyFilter, Aperture can intercept, inspect, and modify the traffic flowing through Envoy, providing more advanced and flexible flow control capabilities.
External Authorization API
The External Authorization API is a feature provided by Envoy Proxy that allows external authorization services to make access control decisions based on metadata extracted from incoming requests. It provides a standard interface for Envoy to call external authorization services for making authorization decisions, which allows for a more flexible and centralized authorization control for microservices.
Control
Using Envoy's External Authorization API enables Aperture to make flow control decisions based on a variety of request metadata beyond Basic HTTP authentication and authorization. By extracting and analyzing data from request headers, paths, query parameters, and other attributes, Aperture can gain a more comprehensive understanding of the flow of traffic between microservices.
This capability allows Aperture to prioritize critical requests over others, ensuring reliable operations at scale. Moreover, by utilizing Aperture flow control, applications can degrade gracefully in real-time, meaning Aperture can prioritize the different workloads.
📌 Aperture uses Envoy's External Authorization definition to describe request metadata, specifically the Attribute Context. However, the ability to extract values from the request body depends on how External Authorization in Envoy was configured.
Access logs
In addition to flow control, Aperture also provides access logs that developers can use to gain insight into the flow of network traffic in their microservices' architecture. These logs capture metadata about each request, such as the request method, path, headers, and response status code, which can be used to optimize application performance and reliability. By analyzing traffic patterns and identifying potential issues or performance bottlenecks, developers can make informed decisions to improve their microservices' architecture.
Aperture extracts fields from access logs containing high-cardinality attributes that represent key attributes of requests and features. You can find all these extracted fields here. These fields allow for a detailed analysis of system performance and behavior and provide a comprehensive view of individual requests or features within services. Additionally, this data can be stored and visualized using Aperture Cloud, making it available for querying using an OLAP backend (Druid).
Let’s jump into the implementation of Aperture with Istio.
Flow Control using Aperture with Istio
Load management is important in web-scale applications to ensure stability and reliability. Aperture provides flow control mechanisms such as weighted fair queuing, distributed rate-limiting, and workload prioritization to regulate the flow of requests and prevent overloading. These techniques help to manage the flow of requests and enable load management.
Demo
Prerequisites
The following are prerequisites before proceeding with Aperture Flow Control Integration with Istio.
- A Kubernetes cluster: For the purposes of this demo, you can use the Kubernetes-in-Docker (Kind) environment.
- Aperture Controller and Aperture Agent installed in your Kubernetes cluster.
- Istio is installed in your Kubernetes cluster.
Step 1: Install Aperture Controller and Aperture Agent
To install Aperture Controller and Aperture Agent running as Daemon Set in your Kubernetes cluster, follow the instructions provided in the Aperture documentation.
Step 2: Install Istio
To install Istio in your Kubernetes cluster, follow the instructions provided in the Istio documentation.
Step 3: Enable Sidecar Injection
To enable Istio sidecar injection for your applications deployments in a specific namespace, run the following command:
kubectl label namespace <namespace-name> istio-injection=enabled
This will add the istio-injection=enabled label to the specified namespace,
allowing Istio to automatically inject sidecars into the pods.
Example:
kubectl create namespace demoapp
kubectl label namespace demoapp istio-injection=enabled
Step 4: Apply Envoy Filters Patches
To configure Aperture with Istio, four patches have to be applied via Envoy Filter. These patches essentially serve the following purposes:
- To merge the values extracted from the filter with the OpenTelemetry Access
Log configuration to the HTTP Connection Manager filter for the outbound
listener in the Istio sidecar running with the application. This is called
the
NETWORK_FILTERPatch. - To merge the OpenTelemetry Access Log configuration with the HTTP Connection
Manager filter for the inbound listener in the Istio sidecar running with
the application. This is also a
NETWORK_FILTERPatch. - To insert the External Authorization before the Router sub-filter of the HTTP
Connection Manager filter for the inbound listener in the Istio sidecar
running with the application. This is called the
HTTP_FILTERPatch. - To insert the External Authorization before the Router sub-filter of the HTTP
Connection Manager filter, but for the outbound listener in the Istio
sidecar running with the application. This is another
HTTP_FILTERPatch.
In simpler terms, the patches are applied to the Istio sidecar running alongside the application. They help to modify the HTTP Connection Manager filter, which manages incoming and outgoing traffic to the application. The patches enable Aperture to extract metadata, such as request headers, paths, and query parameters, to make flow control decisions for each request. This allows Aperture to prioritize critical requests over others, ensure reliable operations at scale, and prevent overloading the application.
Refer to Aperture Envoy Configuration documentation to know more about each patch.
For convenience, Aperture provides two ways to do this,
- Helm: Using
Aperture
istioconfigHelm chart aperturectl: Own Aperture CLI provides a way to doistioconfiginstall inISTIODnamespace.
Using Helm
helm repo add aperture https://fluxninja.github.io/aperture/
helm repo update
helm upgrade --install aperture-envoy-filter aperture/istioconfig --namespace ISTIOD_NAMESPACE_HERE
Using aperturectl
aperturectl install istioconfig --namespace ISTIOD_NAMESPACE_HERE
Example:
aperturectl install istioconfig --namespace istio-system
👉 The default values for the Aperture Agent service namespace are
aperture-agent, the port is 8080, and sidecar mode is false. This means
that the Aperture Agent target URL is
aperture-agent.aperture-agent.svc.cluster.local:8080. If you have installed
the Aperture Agent in a different namespace or port, you can create or update
the values.yaml file and pass it with the install command. Please refer to
the Aperture documentation for more information on how to configure Aperture for
custom values and how to create or update the values.yaml file and pass it
with the install command.
Step 5: Verify Integration
kubectl get envoyfilter aperture-envoy-filter -n ISTIOD_NAMESPACE_HERE
Example command:
kubectl get envoyfilter aperture-envoy-filter -n istio-system
Output:
NAME                    AGE
aperture-envoy-filter   46s
Deploy Demo-App
To demonstrate whether Istio integration is working, install a
demo deployment
in the demoapp namespace with istio-injection enabled.
kubectl create namespace demoapp
kubectl label namespace demoapp istio-injection=enabled
kubectl create -f https://gist.githubusercontent.com/sudhanshu456/10b8cfd09629ae5bbce9900d8055603e/raw/cfb8f0850cc91364c1ed27f6904655d9b338a571/demoapp-and-load-generator.yaml -n demoapp
Check pods are up and running.
kubectl get pods -n demoapp
Output:
NAME                                  READY   STATUS    RESTARTS   AGE
service1-demo-app-686bbb9f64-rhmpp    2/2     Running   0          14m
service2-demo-app-7f8dd75749-zccx8    2/2     Running   0          14m
service3-demo-app-6899c6bc6b-r4mpd    2/2     Running   0          14m
wavepool-generator-7bd868947d-fmn2w   1/1     Running   0          2m36s
Apply Policy using aperturectl
To demonstrate control points and their functionality, we will use an
Adaptive Service Protection policy.
Below is the values.yaml file we will apply using aperturectl. Use the
command below to generate the values file.
aperturectl blueprints values --name=load-scheduling/average-latency --output-file=values.yaml
- values.yaml
policy:
  # Name of the policy.
  # Type: string
  # Required: True
  policy_name: basic-service-protection
  service_protection_core:
    adaptive_load_scheduler:
      load_scheduler:
        # The selectors determine the flows that are protected by this policy.
        # Type: []aperture.spec.v1.Selector
        # Required: True
        selectors:
          - control_point: ingress
            service: service1-demo-app.demoapp.svc.cluster.local
  latency_baseliner:
    # Tolerance factor beyond which the service is considered to be in overloaded state. E.g. if the long-term average of latency is L and if the tolerance is T, then the service is considered to be in an overloaded state if the short-term average of latency is more than L*T.
    # Type: float64
    latency_tolerance_multiplier: 1.1
    # Flux Meter defines the scope of latency measurements.
    # Type: aperture.spec.v1.FluxMeter
    # Required: True
    flux_meter:
      selectors:
        - control_point: ingress
          service: service1-demo-app.demoapp.svc.cluster.local
Use the following command to apply to generate the blueprint policy.
aperturectl blueprints generate --name=load-scheduling/average-latency --values-file=values.yaml --output-dir=policy-gen
Now, apply the policy using the following command:
aperturectl apply policy --file=policy-gen/policies/load-scheduling.yaml --kube
Validate Policy
Let’s check whether the policy is applied or not
kubectl get policy -n aperture-controller
Output:
NAME                       STATUS     AGE
basic-service-protection   uploaded   11s
List Active Control Points using aperturectl
Control points are the targets for flow control decision-making. By defining
control points, Aperture can regulate the flow of traffic between services by
analyzing request metadata, such as headers, paths, and query parameters.
Aperture provides a command-line interface called aperturectl that allows you
to view active control points and live traffic samples.
Using aperturectl flow-control control-points, you can list active control
points.
aperturectl flow-control control-points --kube
Output:
AGENT GROUP   SERVICE   NAME
default       egress    service1-demo-app.demoapp.svc.cluster.local
default       egress    service2-demo-app.demoapp.svc.cluster.local
default       ingress   service1-demo-app.demoapp.svc.cluster.local
default       ingress   service2-demo-app.demoapp.svc.cluster.local
default       ingress   service3-demo-app.demoapp.svc.cluster.local
Live Previewing Requests using aperturectl
aperturectl provides a flow-control preview feature that enables you to view
live traffic and visualize it. This feature helps you understand the incoming
request attributes, which is an added benefit on top of Istio. You can use this
feature to preview incoming traffic and ensure that Aperture is making the
correct flow control decisions based on the metadata extracted from the request
headers, paths, query parameters, and other attributes.
aperturectl flow-control preview --kube service1-demo-app.demoapp.svc.cluster.local ingress --http --samples 1
Output:
{
  "samples":  [
    {
      "attributes":  {
        "destination":  {
          "address":  {
            "socketAddress":  {
              "address":  "10.244.1.11",
              "portValue":  8099
            }
          }
        },
        "metadataContext":  {},
        "request":  {
          "http":  {
            "headers":  {
              ":authority":  "service1-demo-app.demoapp.svc.cluster.local",
              ":method":  "POST",
              ":path":  "/request",
              ":scheme":  "http",
              "content-length":  "201",
              "content-type":  "application/json",
              "cookie":  "session=eyJ1c2VyIjoia2Vub2JpIn0.YbsY4Q.kTaKRTyOIfVlIbNB48d9YH6Q0wo",
              "user-agent":  "k6/0.43.1 (https://k6.io/)",
              "user-id":  "52",
              "user-type":  "subscriber",
              "x-forwarded-proto":  "http",
              "x-request-id":  "a8a2684d-9acc-4d28-920d-21f2a86c0447"
            },
            "host":  "service1-demo-app.demoapp.svc.cluster.local",
            "id":  "14105052106838702753",
            "method":  "POST",
            "path":  "/request",
            "protocol":  "HTTP/1.1",
            "scheme":  "http"
          },
          "time":  "2023-03-15T11:50:44.900643Z"
        },
        "source":  {
          "address":  {
            "socketAddress":  {
              "address":  "10.244.1.13",
              "portValue":  33622
            }
          }
        }
      },
      "parsed_body":  null,
      "parsed_path":  [
        "request"
      ],
      "parsed_query":  {},
      "truncated_body":  false,
      "version":  {
        "encoding":  "protojson",
        "ext_authz":  "v3"
      }
    }
  ]
}
What's next?
- Generating and Applying Policies: Check out our tutorials on flow-control and load-management techniques here.
Conclusion
In this blog post, we have explored the concept of a service mesh, which is a tool used to manage the communication between microservices in a distributed system. We have also discussed how Aperture can integrate with Istio, an open source service mesh framework, to provide enhanced load management capabilities. By following a few simple steps, you can get started with using the load management techniques offered by Aperture to improve the performance and reliability of your services.
We invite you to sign up for Aperture Cloud, offering Aperture as a service with robust traffic analytics, alerts, and policy management. Learn more about using Aperture open-source for reliability automation by visiting our GitHub repository and documentation site. Lastly, we welcome you to join our vibrant Discord community to discuss best practices, ask questions, and engage in insightful discussions with like-minded individuals.