

Highly available and reliable Services are a hallmark of any thriving business in today’s digital economy. As a Service owner, it is important to ensure that your Services stay within SLAs. But when bugs make it into production or user traffic surges unexpectedly, services can slow down under a large volume of requests and fail. If not addressed in time, such failures tend to cascade across your infrastructure, sometimes resulting in a complete outage.
At FluxNinja, we believe that adaptive concurrency limits are the most effective way to ensure services are protected and continue to perform within SLAs.
What are Concurrency Limits?

Concurrency is the number of requests a service can handle at any given time. It
is calculated using Little’s Law, which states that in the long-term, steady
state of a production system, the average number of items L in the system is the
product of the average arrival rate λ and the average time W that an item spends
in the system, that is, L=λW. If any excess requests come in beyond L, they
cannot be served immediately and must be queued or rejected. And this could lead
to a significant build-up of queues, slowing down service response times.
However, queues do not build if services are within their concurrency limits.

Concurrency limits are hard to estimate, especially when there are numerous interdependent microservices and fast-moving environments.
- Updates in microservices: Micro-services are updated frequently, and whatever concurrency limit you set initially could be outdated in the next release of your microservice, resulting in a performance bottleneck or service outage. Additionally, feature additions and configuration changes make it hard to keep up with changing concurrency limits.
- High churn environments: Scale-in and scale-out events change concurrency limits - when services scale out, concurrency limits need to be dynamically adjusted to balance out incoming traffic.
This is why dynamically setting concurrency limits (Adaptive Concurrency Limits) based on overall service health is the best way to protect a service & stay within SLAs.
Difference between Adaptive Concurrency Limits and Rate Limits
At first glance, both concurrency limits and rate limits seem to do the same job. But they serve distinct purposes.
Rate limits are a preventive technique - they prevent misuse of a service by a particular user, making sure the service remains available for other users. But this technique does not help if there is a surge in overall traffic, not attributed to any specific user.
However, adaptive concurrency limits are a protective reliability technique. Using adaptive concurrency limits, it is possible to detect when the number of requests to a service exceeds the concurrency limit of a service, and have reliability interventions kick-in.
Using Aperture For Adaptive Concurrency Limits
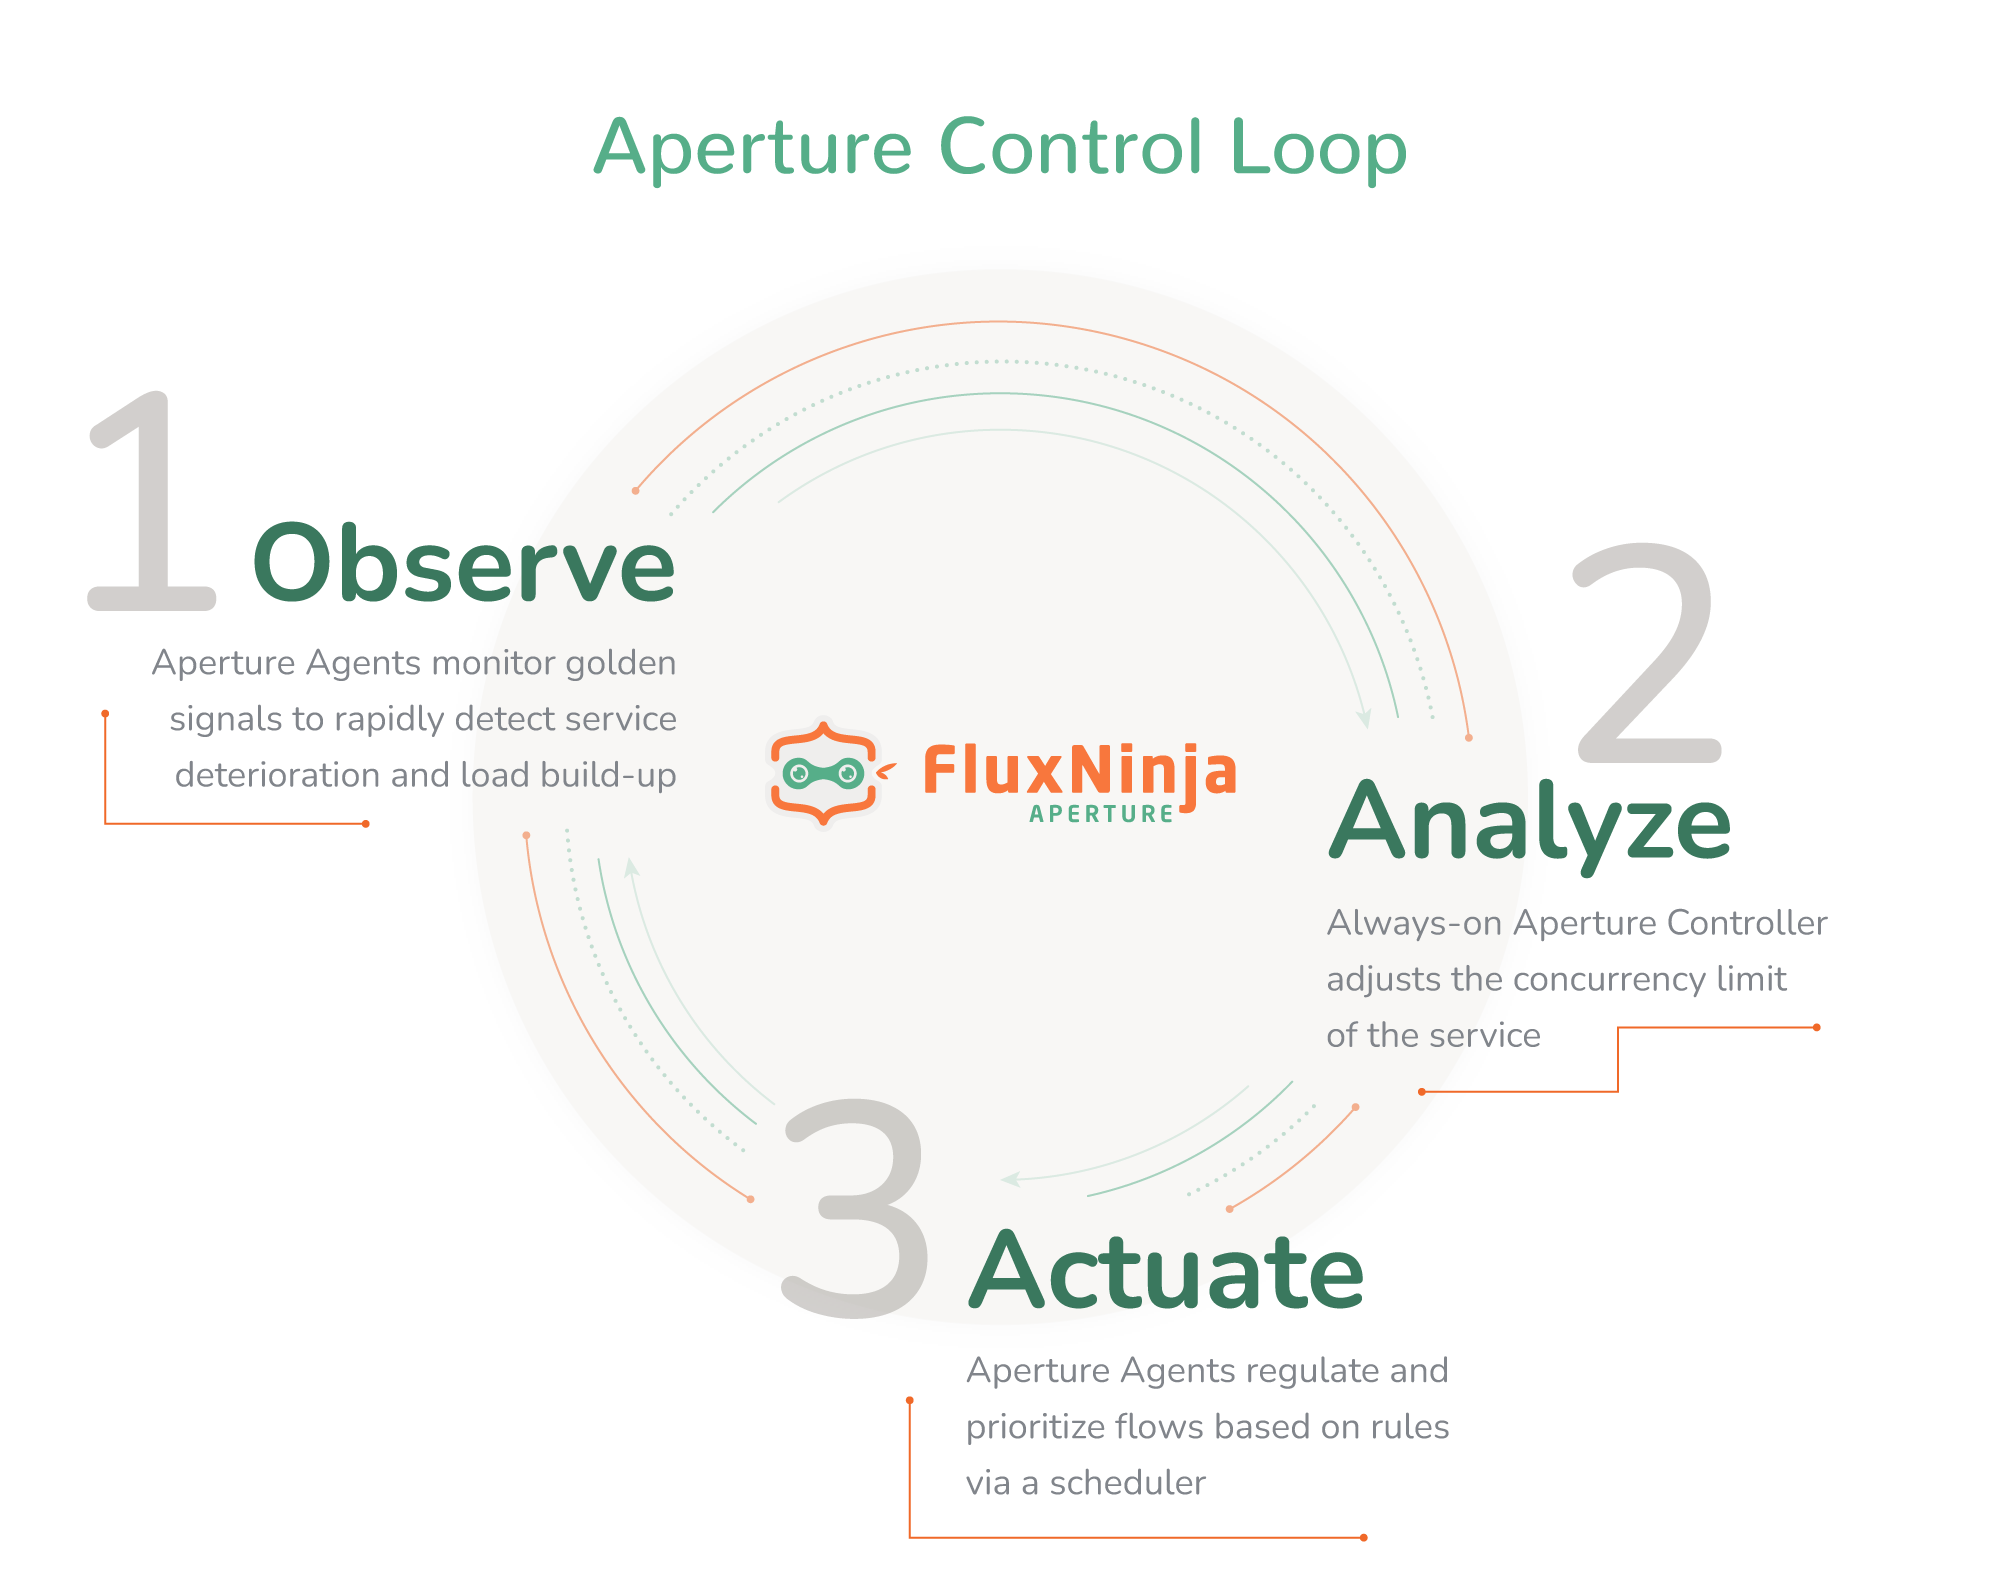
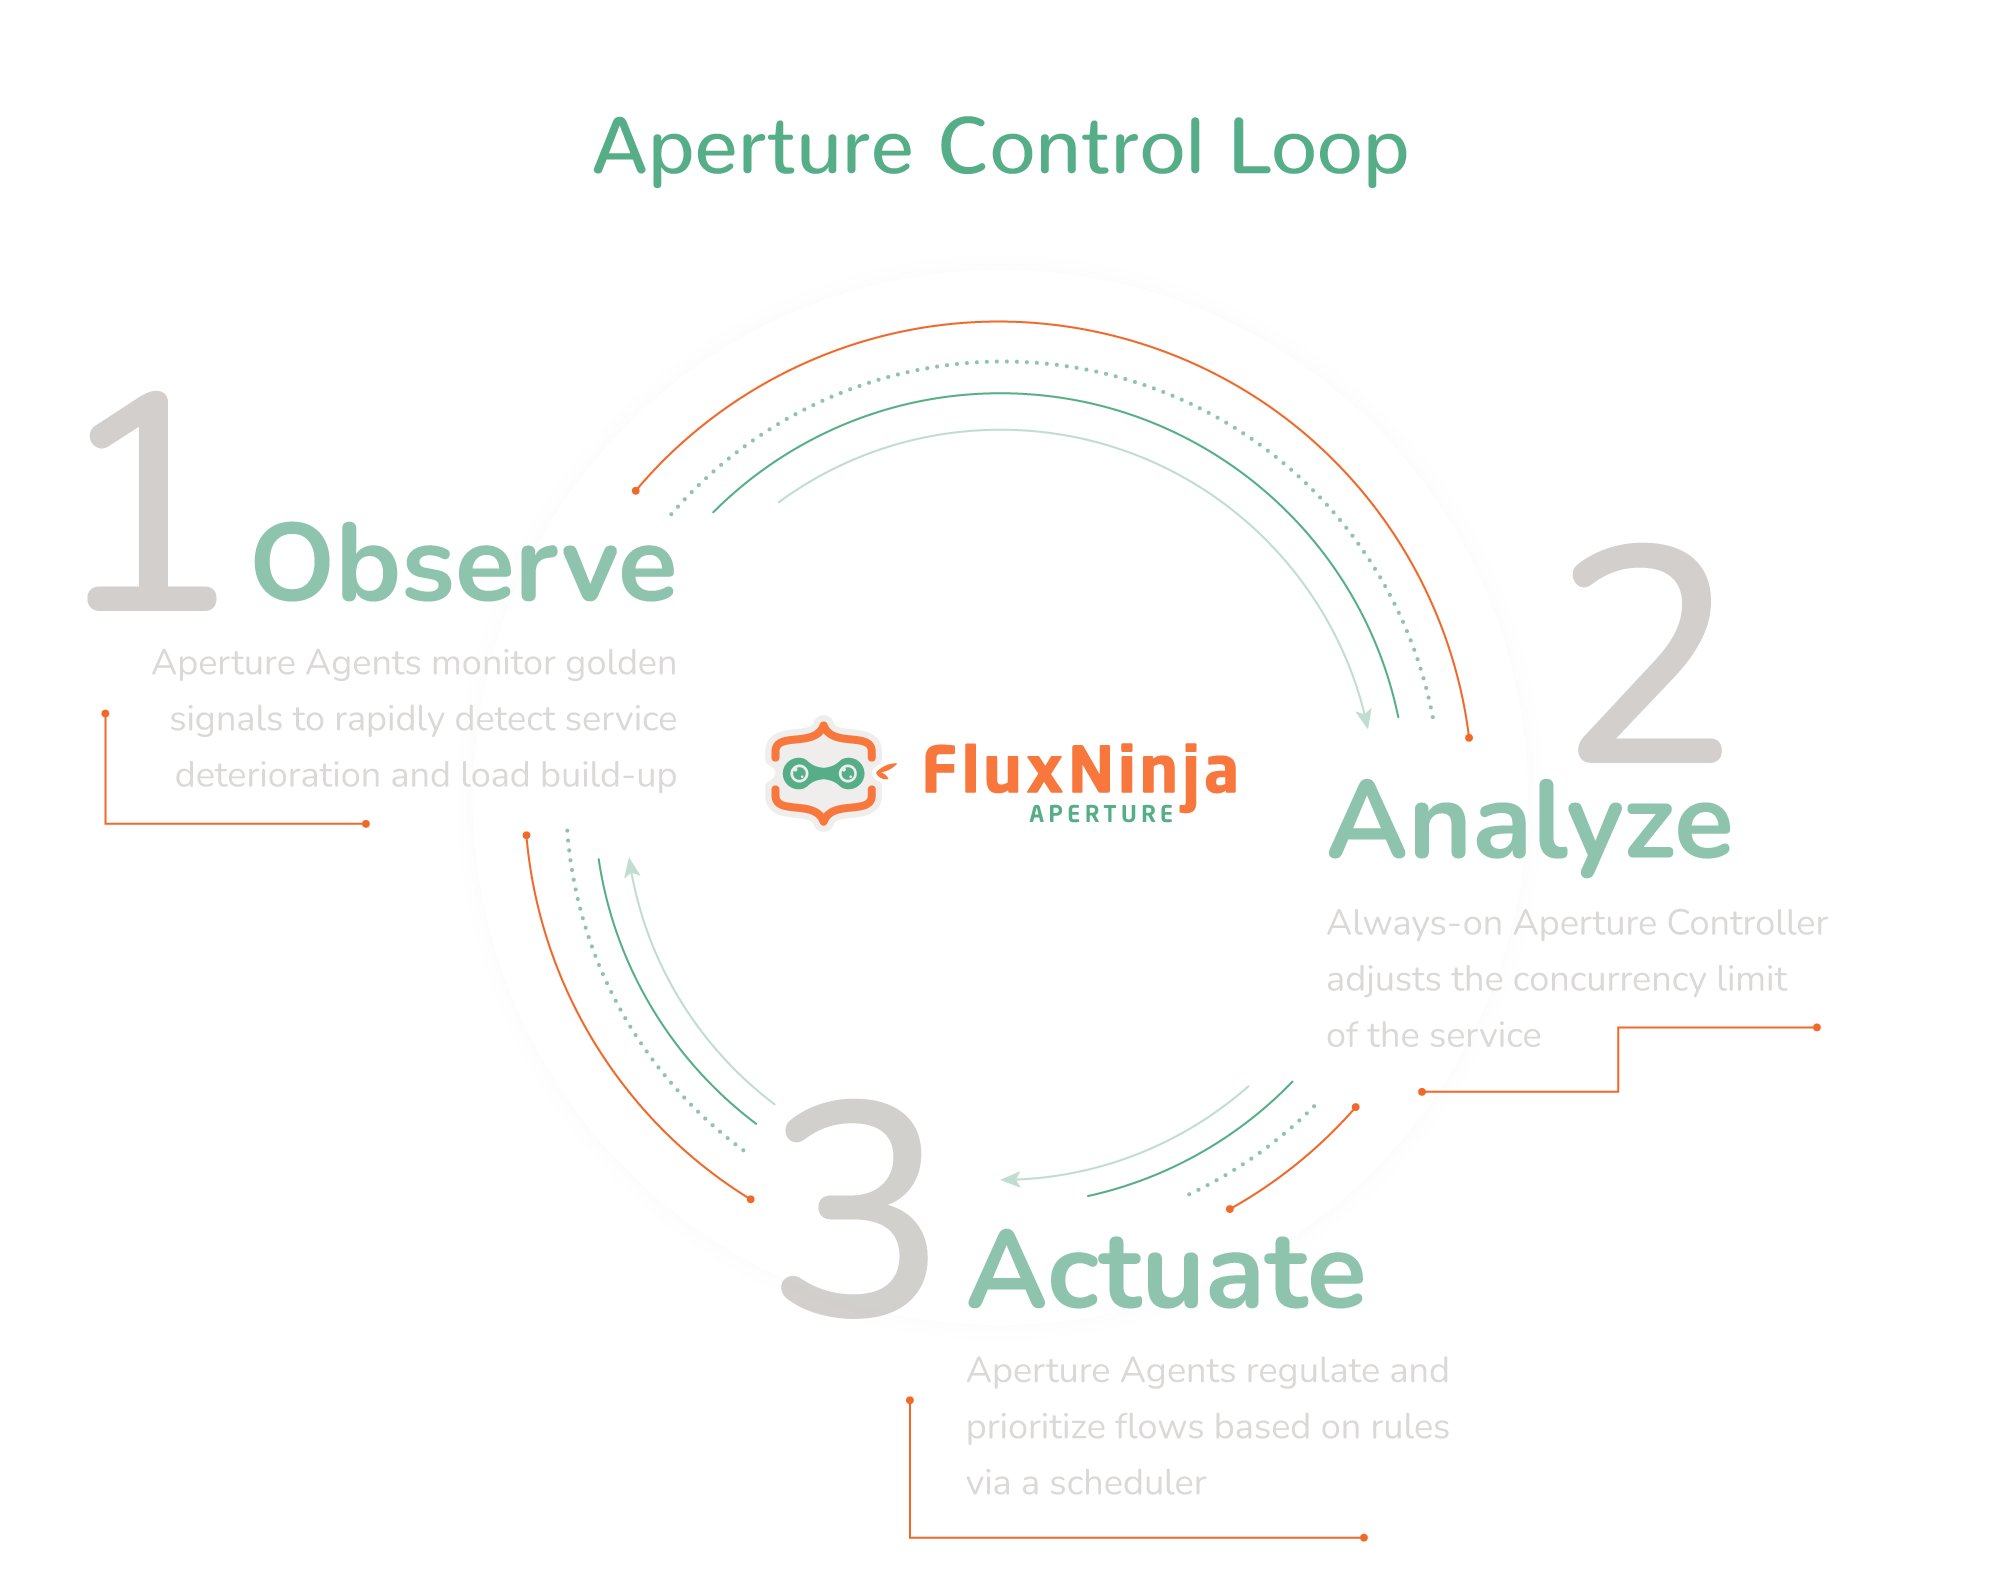
Aperture is an open source flow control and reliability platform which can help you set adaptive concurrency limits for your services. At the heart of Aperture is a control loop, manifested by:
- Observing: Aperture agents monitor the deviation of your service’s current latency from historical trends using Golden Signals and identify load build-up or deterioration.
- Analyzing: Aperture Controller, which is the control loop's brain, continuously evaluates deviations from SLAs and communicates flow control decisions back to the agents.
- Actuating: Aperture agents sit right next to the service instances, regulating and prioritizing requests through a scheduler.
To showcase how Adaptive Concurrency Limits can be set in practice, let's deep dive into a demo setup of Aperture agents and controllers.
Demo Setup
Aperture includes a playground, pre-configured with a traffic generator, a sample application, and an instance of Grafana that you can use to see various signals generated by a policy.
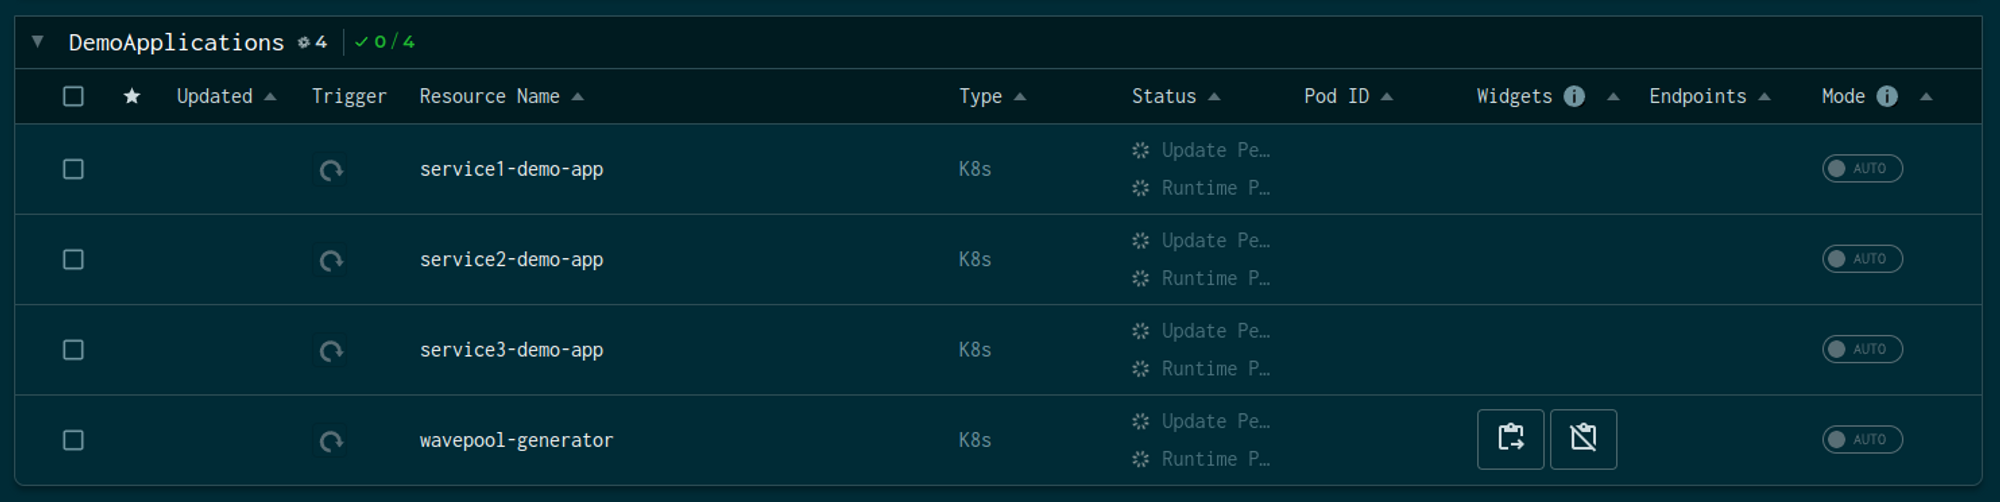
The above snap shows a demo application with three services and a traffic
generator named wavepool-generator.
Service Topology
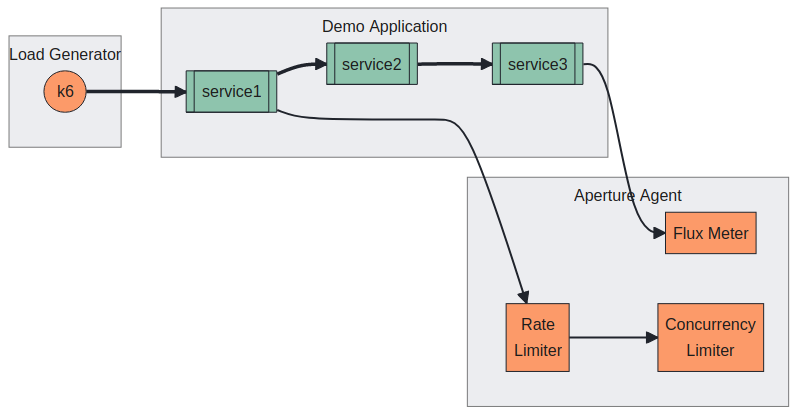

The demo application is an example of microservices topology, where the request
flows from service1 to service2 and service2 to service3. Each service
adds a delay with a jitter to simulate processing. Service 3 is the upstream
service configured with an artificial concurrency limit to simulate overload
scenarios.
Traffic Pattern
The traffic generator is designed to generate a symmetrical traffic load for two types of users — subscribers and guests. Basically, the load generator alternates between regular traffic and high-traffic scenarios periodically.
export let vuStages = [
  { duration: "10s", target: 5 },
  { duration: "2m", target: 5 },
  { duration: "1m", target: 30 },
  { duration: "2m", target: 30 },
  { duration: "10s", target: 5 },
  { duration: "2m", target: 5 },
];

export let options = {
  discardResponseBodies: true,
  scenarios: {
    guests: {
      executor: "ramping-vus",
      stages: vuStages,
      env: { USER_TYPE: "guest" },
    },
    subscribers: {
      executor: "ramping-vus",
      stages: vuStages,
      env: { USER_TYPE: "subscriber" },
    },
  },
};
And generating the following traffic pattern –
- Ramp up to
5concurrent users in10s. - Hold at
5concurrent users for2m. - Ramp up to
30concurrent users in1m(overloadsservice3). - Hold at
30concurrent users for2m(overloadsservice3). - Ramp down to
5concurrent users in10s. - Hold at
5concurrent users for2m.
Deploying Aperture Policies for Adaptive Concurrency Limits
Aperture includes a pre-packaged list of Aperture Policies and Grafana Dashboards that can be used both as a guide for creating new policies and as ready-to-use Aperture Blueprints for generating policies customized to a Service and the use case. Policies are evaluated periodically, as defined in blueprints. Read more about Aperture Policy generation here.
The playground is configured with a
Latency Gradient Policy.
This policy is configured to measure the service latency of service3 through
Flux Meter, and that signal is used to detect an overloaded state. The
concurrency limiter is configured on service1, which is the downstream service
(see Service Topology). This ensures that when service3 is overloaded, we stop
accepting additional requests at the entry point, i.e., service1, to avoid
wasted work.
Aperture includes a dry run mode that can be configured dynamically, allowing us to validate policy behavior without affecting the incoming traffic.
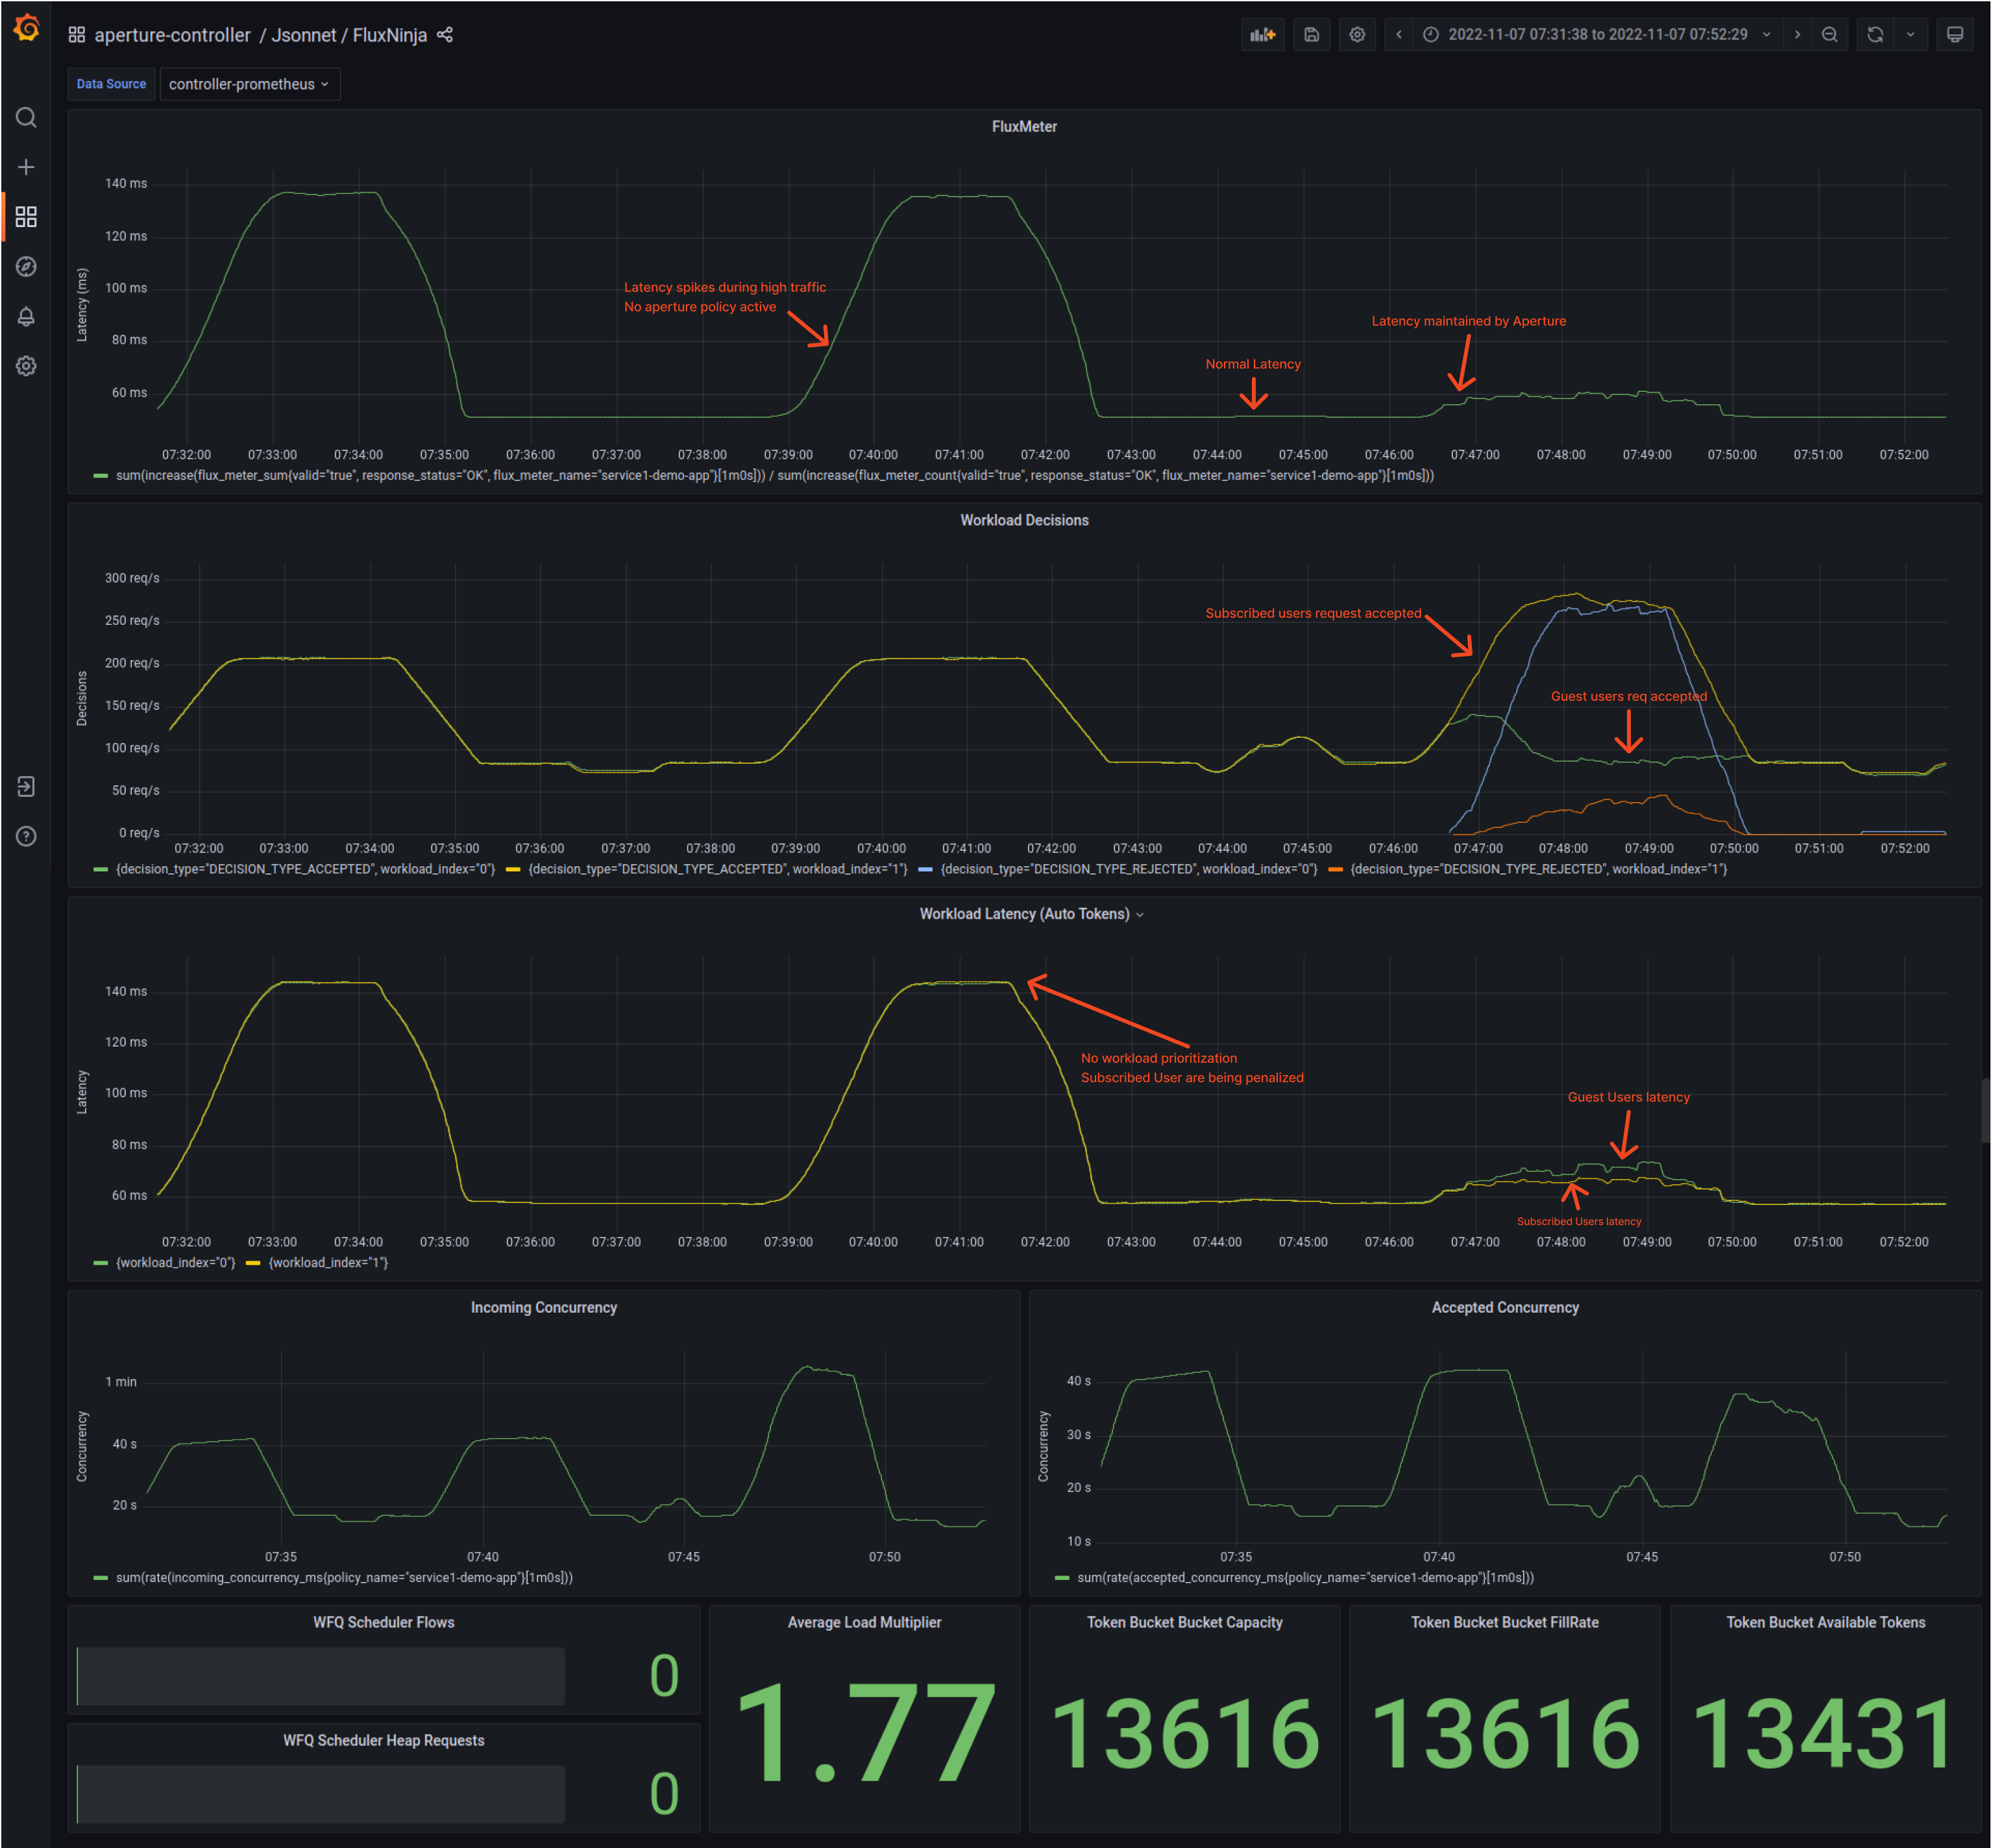
When no protection is set up for services
Using the Grafana dashboard provided by Aperture, the latency of service 3 (In
this case, Aperture policy is running in
dry run
mode) can be easily monitored.
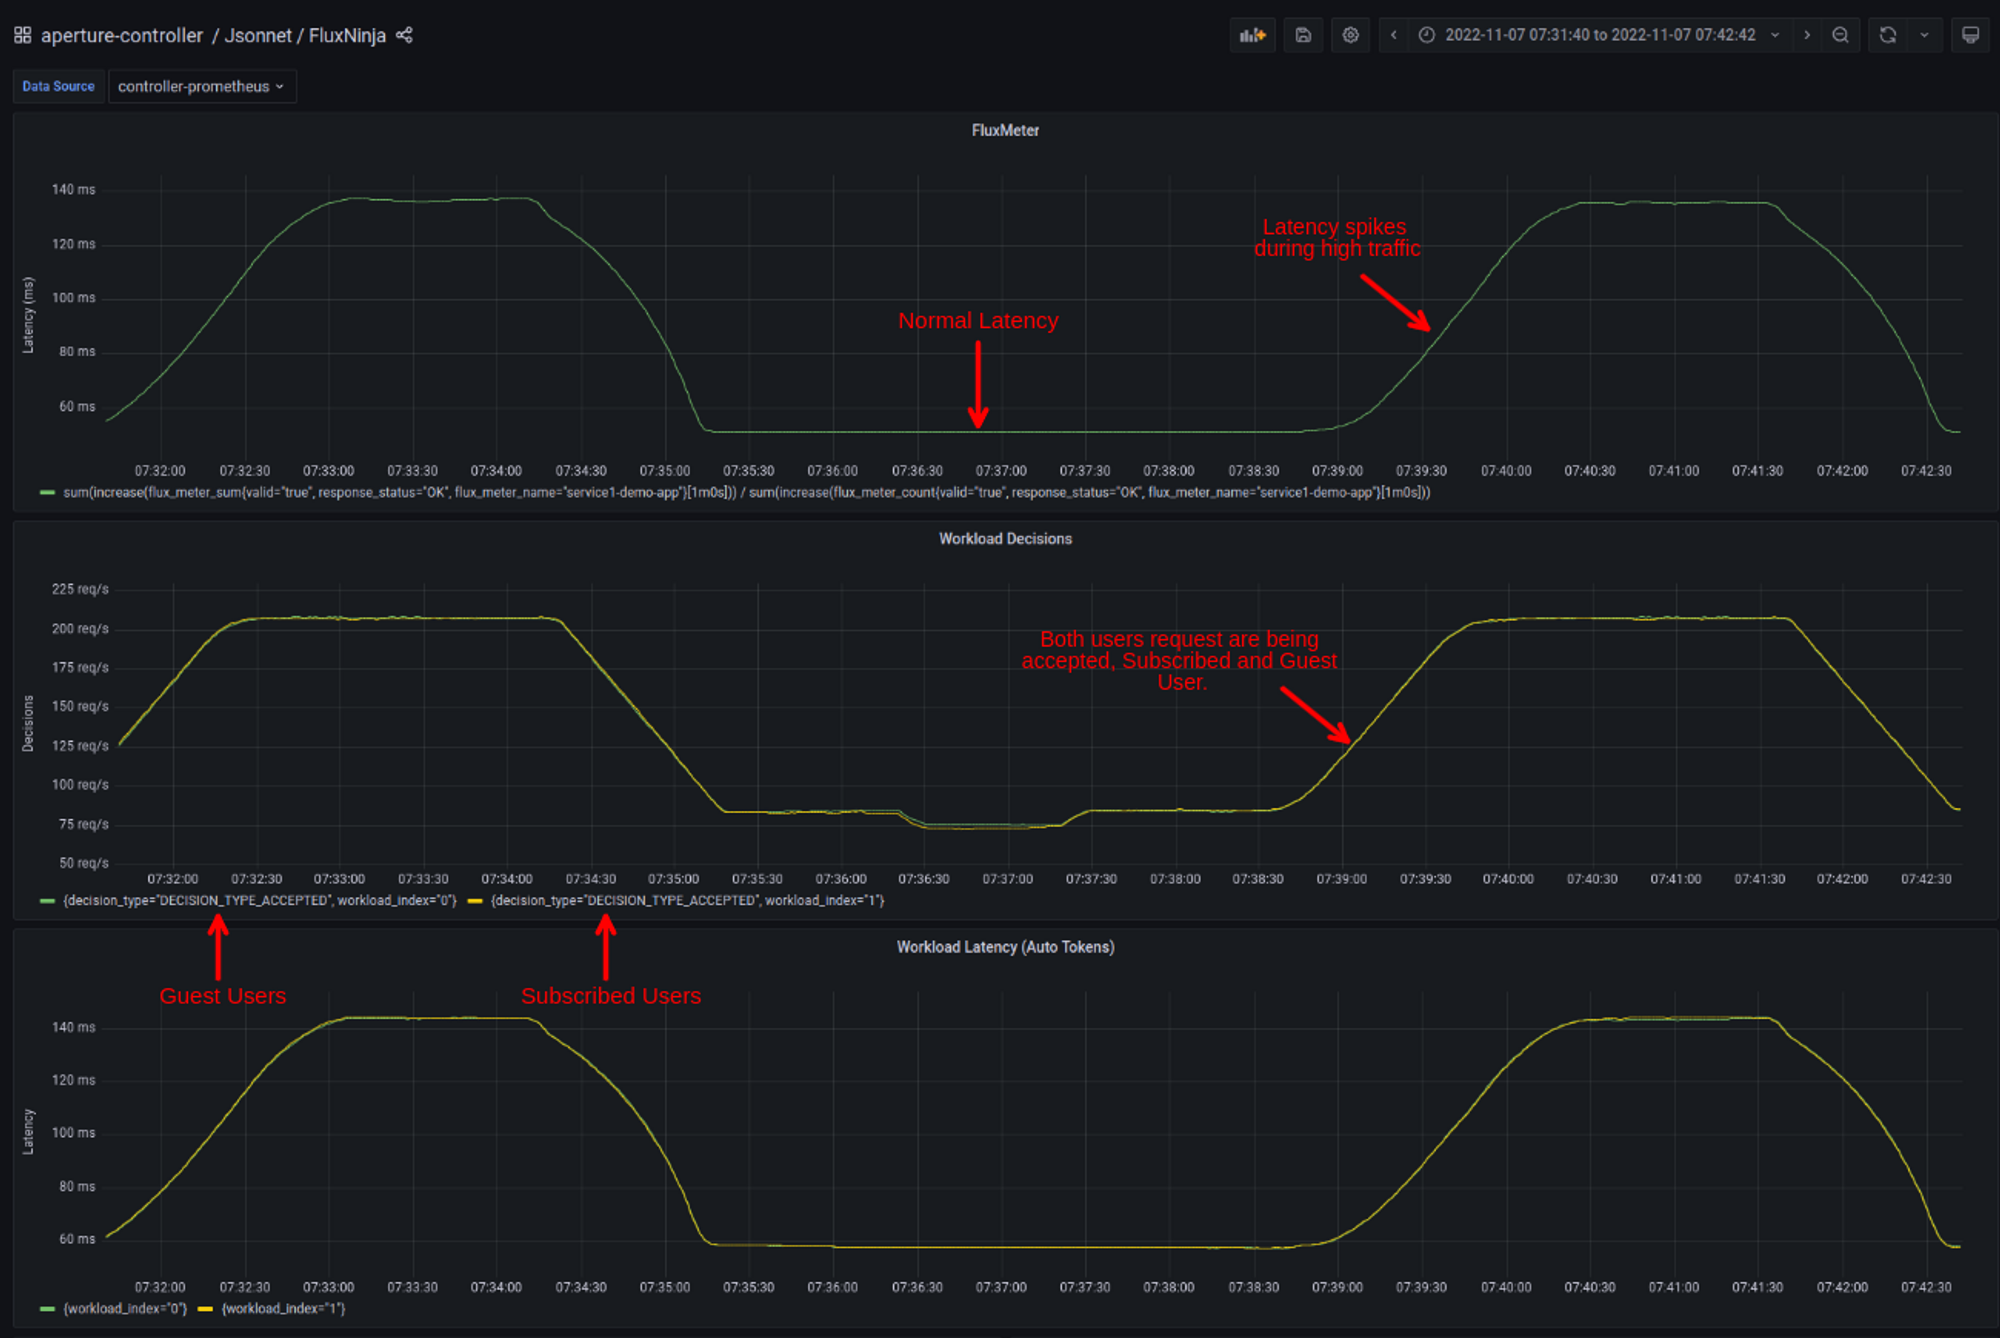
Traffic ramping up
Once the Traffic generator starts ramping up the number of users, the latency of
service3 (under Flux Meter panel) starts touching 140ms. Whereas in normal
conditions, it is under 60ms. These latency spikes could lead to a bad user
experience, or if this latency keeps on increasing, it will hit client timeout,
and service would become completely unavailable, triggering a potential
cascading failure
throughout the application.
Also, it is worth mentioning; subscribed users' workload is not prioritized, which implies if guest users make too many requests, the subscribed users will face the consequences such as high latency and request time-out problems.
When Aperture is protecting the service
Once Aperture becomes active, it will start evaluating all the signals. The
Signals Dashboard is available under aperture-controller inside Grafana. These
signals are passed through a circuit, converting signals into control decisions.
Golden signal metrics in Prometheus are imported as Signals, and each signal can be plotted for understanding the functioning of a circuit, such as –
EMA- This is used to calculate Latency Setpoint.IS_OVERLOAD- Tracks whether the policy thinks a service is overloaded.LOAD_MULTIPLIER- Tracks load-shedding decisions being published to Aperture Agents- And so on.
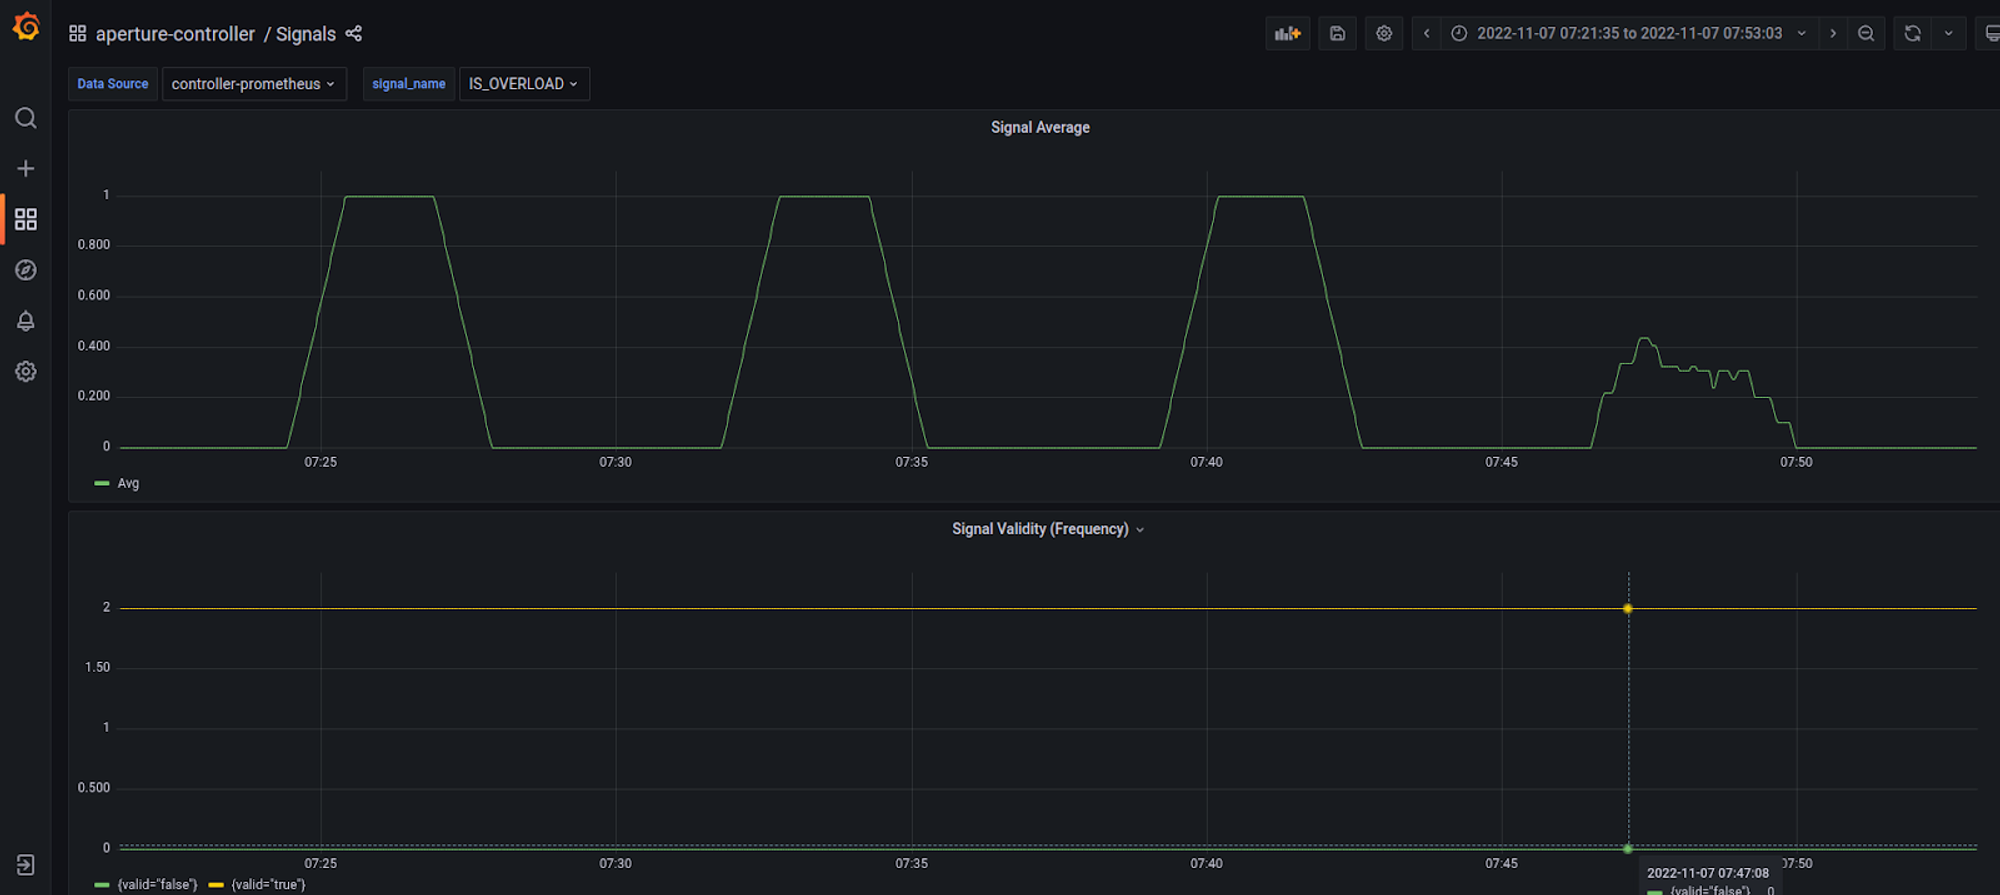
Signals Dashboard
After evaluating signals through circuits, decisions are made. One of the policy's benefits is that it can be customized for maximum acceptance latency based on requirements and SLO.
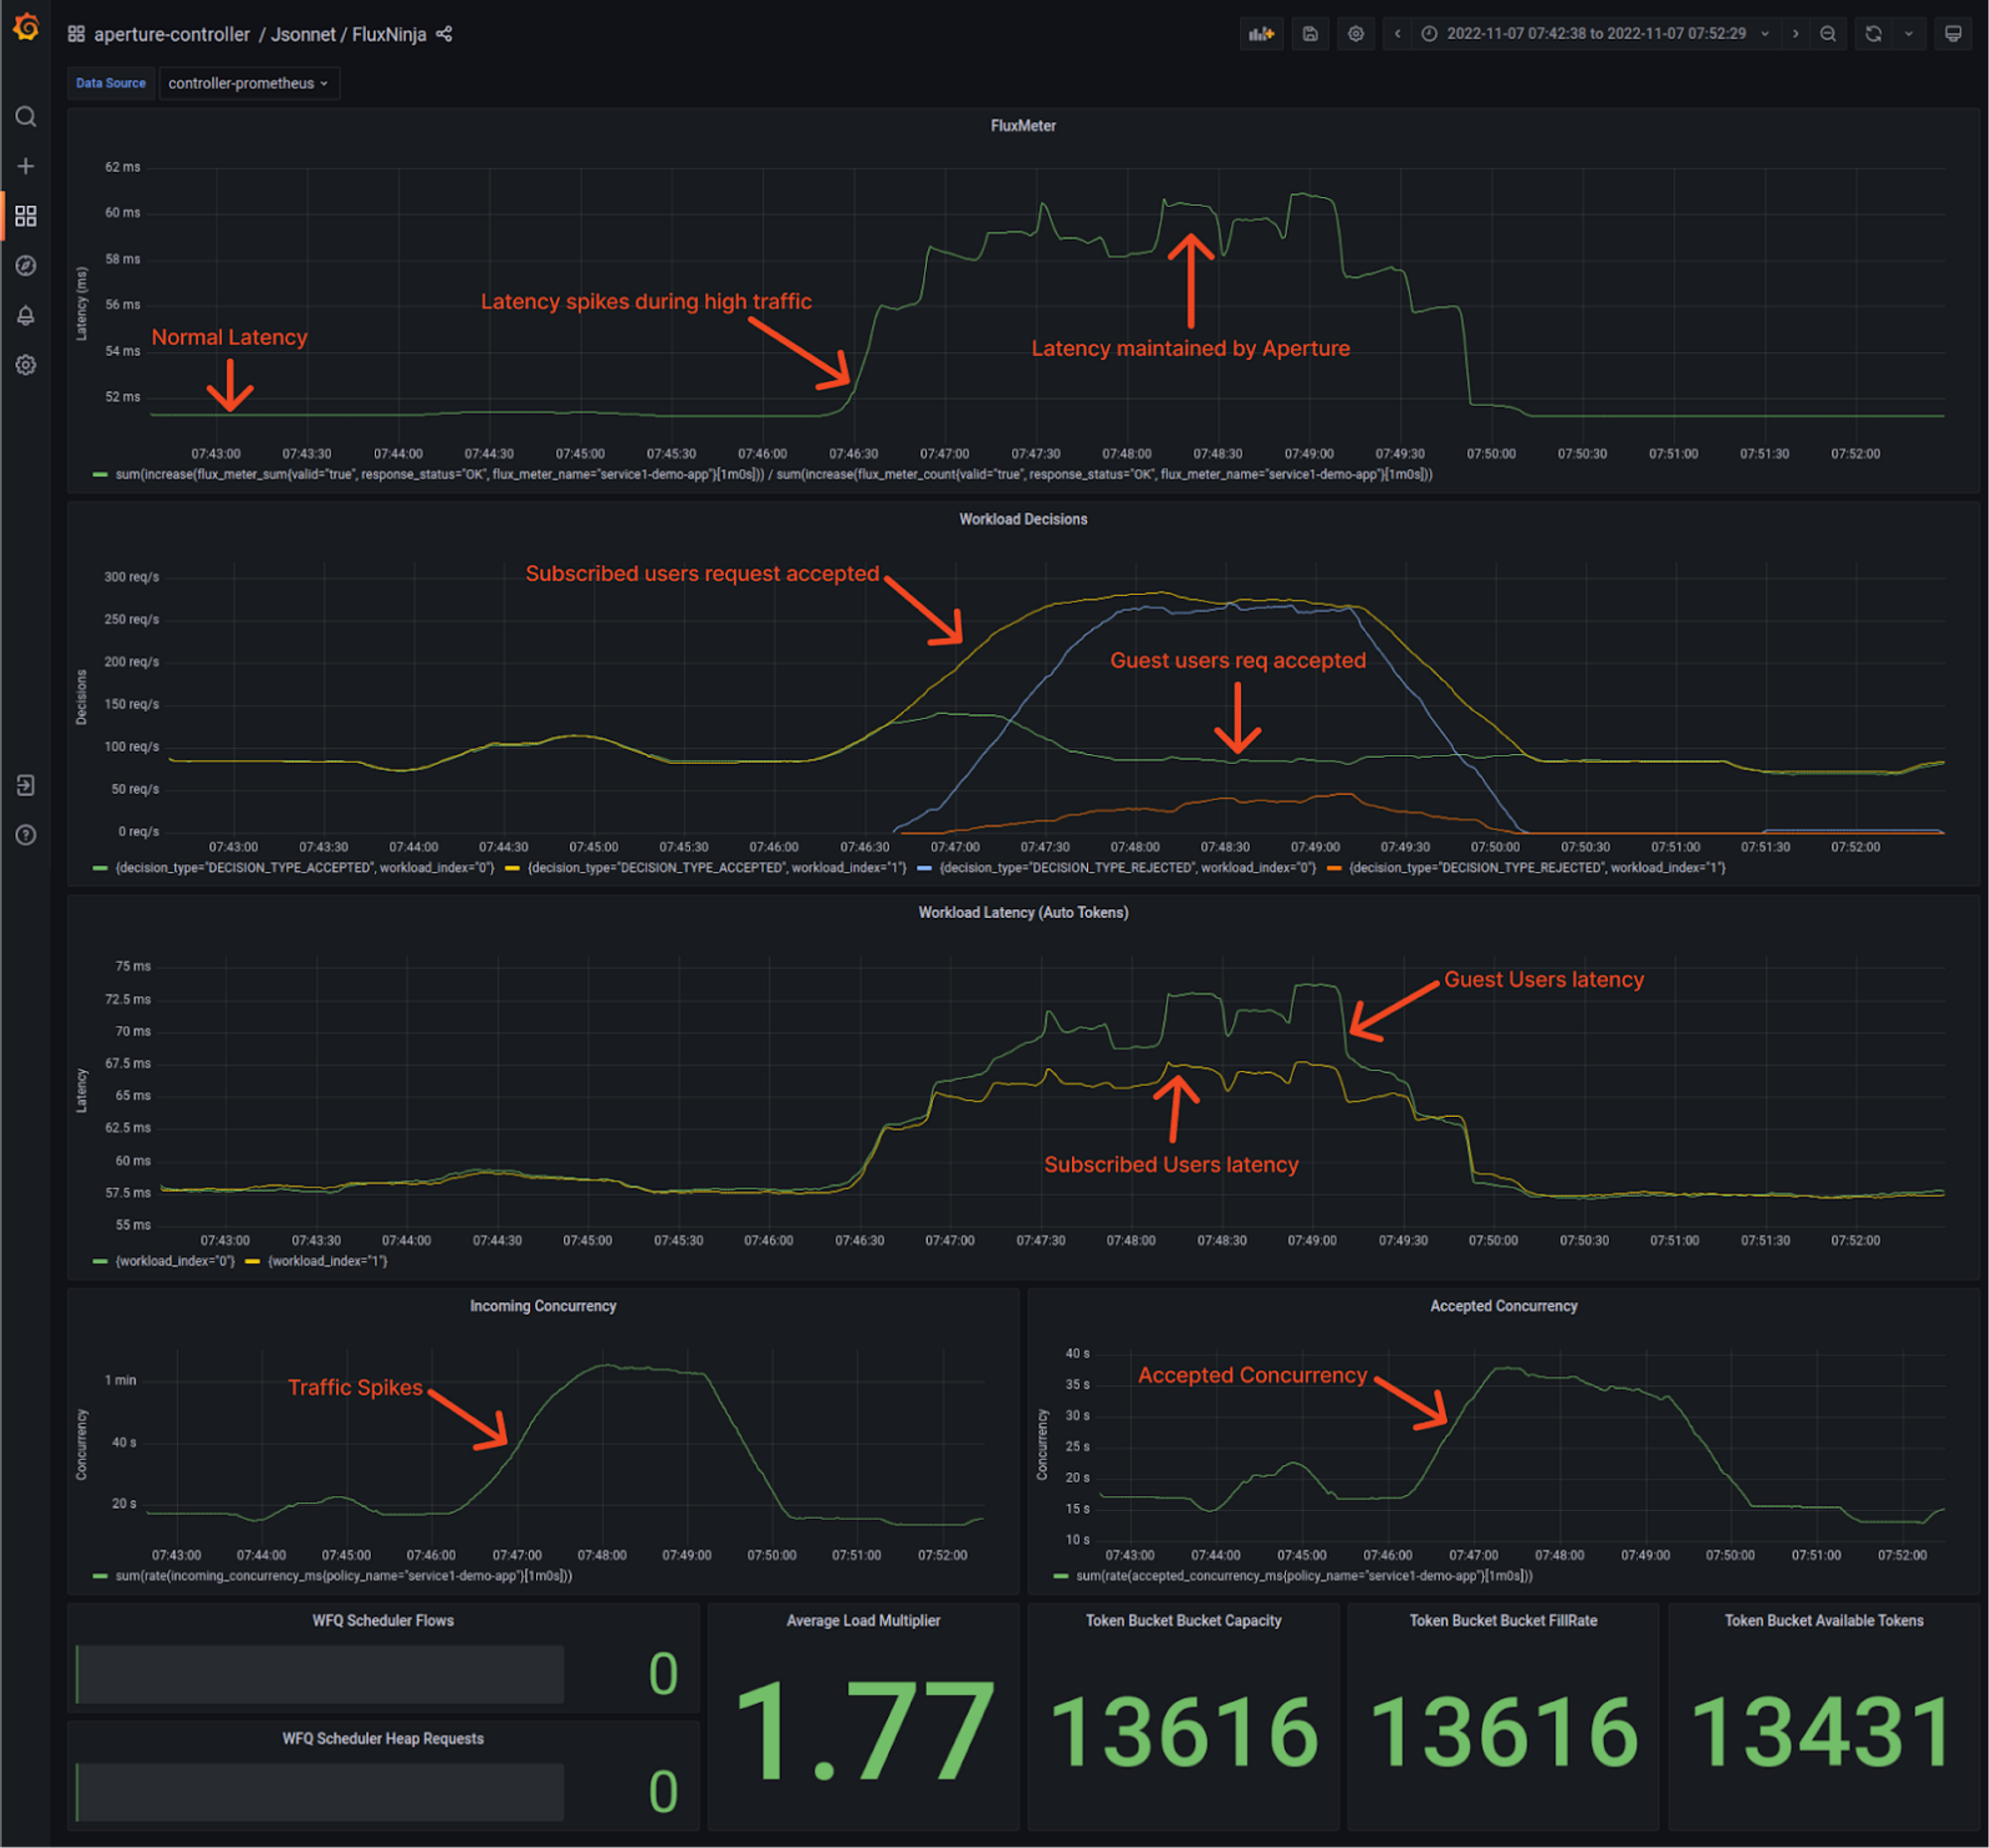
When Aperture is protecting service.
Here, the traffic pattern is the same as earlier. However, this time around, Aperture is using service concurrency limits to decide whether to approve a request for processing or reject it.
Normal traffic scenario
Under normal circumstances, latency hovers around 50ms. That’s where Aperture is learning the baseline latency by doing an exponential moving average on latency readings. To track incoming traffic, check out the “Incoming Concurrency” panel, and for the accepted traffic, check the “Accepted Concurrency” panel, as shown above in the snapshot.
Both Guest and Subscriber workloads shown on indices 0 and 1, respectively, have equal acceptance rates in the “Workload Decisions” panel, as there are no traffic drops during normal loads at the start.
In addition, Aperture automatically estimates the cost of admitting the request for each workload, which can be tracked in the “Workload Latency” panel. This estimation helps with prioritization and fair scheduling of requests during overload scenarios. Aperture’s Scheduler can prioritize workloads based on request attributes. For example, in this policy, subscribed user workload is configured to have higher priority than guest user workloads.
Traffic ramping up
When traffic generators start ramping up the concurrent number of users,
service3 will come under a situation of overload, causing latency to go up. As
soon as Aperture detects this latency spike, it limits concurrency on
service1. Based on the
priorities
configured in the policy, more subscribed workloads traffic is being accepted
compared to guest workloads.
During the spike in traffic, you see that the “Incoming Concurrency” graph ramps up, but Aperture Agent tries to automatically adjust the “Accepted Concurrency” by flattening the graph. Eventually, as the traffic ramps down, both graphs return to normal.
In the Flux Meter panel, it's visible that the latency on service3 is being
maintained within the configured tolerance level, ensuring the service remains
responsive throughout the traffic spike.
Traffic ramping down
The traffic spike is subsiding as the traffic rate goes down to normal levels. In the background, the latency gradient policy will keep load shedding to maintain its safe concurrency limit, a limit where the service is not overloaded.
Once the service is no longer overloaded, the Aperture Latency Gradient Policy will try to increase the concurrency limit of the service periodically, leading to maximum acceptance rates of requests.
Across-the-board Overview of Aperture between protecting and unprotected service.
Overall, there is an enormous difference when Aperture comes into the picture, controlling the flow of requests and maintaining latency throughout the period when traffic is ramping up. Latency significantly drops when Aperture is protecting the service.
Conclusion
In this blog post, we learn how powerful Adaptive Concurrency Limits can be in protecting services from overloads and how Aperture policies can be used to set them. This helps service owners with:
- Preventing cascading failures with load shedding at the right place & time.
- Providing a high-quality user experience with workload prioritization and a high capacity for critical API requests.
- Keeping services within SLA with adaptive service protection.
In future posts, we will dive deeper into how Aperture enables prevention, escalation, and recovery techniques for reliability management.
To get started with Aperture open source, visit our GitHub repository and documentation site. Join our vibrant Discord community to discuss best practices, ask questions, and engage in insightful discussions with like-minded individuals.