

In today's world of rapidly evolving technology, it is more important than ever for businesses to have systems that are reliable, scalable, and capable of handling increasing levels of traffic and demand. Sometimes, even the most well-designed microservices systems can experience failures or outages. There are several examples in the past where companies like Uber, Amazon, Netflix, and Zalando faced massive traffic surges and outages. In the case of Zalando (Shoes & Fashion Company), the whole cluster went down; one of the attributes was high latency, causing critical payment methods to stop working and impacting both parties, customers, and the company. This outage caused them a monetary loss. Later on, companies started adopting the graceful degradation paradigm.

Why Graceful Degradation?
To ensure that applications can continue functioning properly in adverse conditions, the concept of graceful degradation is vital. Graceful degradation refers to a system's ability to keep functioning even in a reduced capacity during high traffic surges or other issues. It ensures that the system can continue to provide the user with the best possible experience by serving priority requests and discarding non-essential ones.
In an OTT platform, for example, graceful degradation can help provide reliable streaming during high traffic while discarding non-essential requests. A real-world example of graceful degradation in practice was shared by Hotstar at AWS Re:Invent 2019, where they shared how they supported serving 25M concurrent users by serving high-priority requests first in traffic surges and were able to maintain high service availability.
Workload Prioritization
Workload Prioritization is an essential aspect of achieving graceful degradation. It determines the order in which incoming requests are processed based on their relative importance or priority. By prioritizing the most important requests, the system can ensure that it provides a good user experience while still being able to handle the large volume of incoming requests.
Graceful Degradation using Aperture
Aperture is an open source platform that can help businesses achieve graceful degradation with ease. It comes equipped with a weighted fair queuing scheduler that allows fair prioritization of workloads, enabling graceful degradation in the face of overloads and other failures and maximizing user experience and revenue. It ensures subscribed users get priority over guest users, and requests related to mission-critical features get higher priority than non-critical requests.
By implementing Aperture policies for workload prioritization and implementing flow control concepts, businesses can ensure that their systems can handle a large volume of incoming requests while still providing a good user experience.
In the remainder of this blog post, we’ll explore Aperture’s graceful degradation features using a demo setup.
Demo Setup
Aperture includes a playground pre-configured with a traffic generator and a
sample demo application. The demo application has three services, each with two
replicas deployed in the demoapp namespace. The playground also has the
Aperture Agent
installed as a DaemonSet,
and the demo application comes ready with an Envoy sidecar proxy that is
configured to communicate with the Aperture Agent. You can read more about it
here.
Additionally, the playground comes equipped with a Grafana, which can be used to import various dashboards generated by a policy.
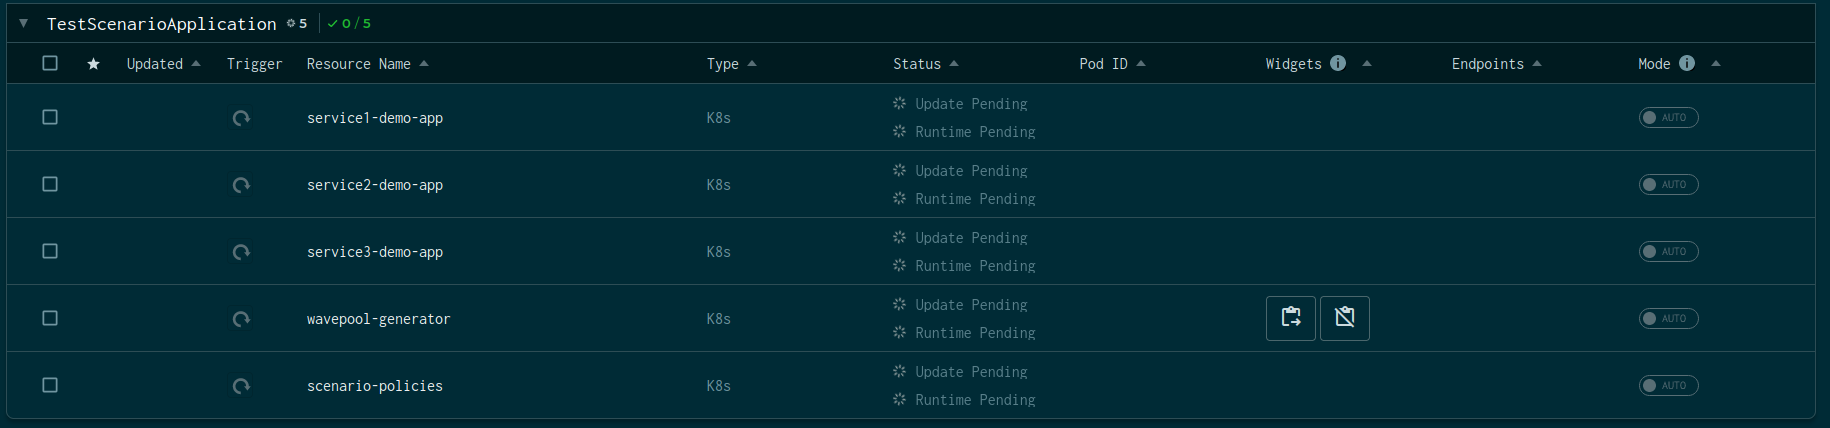
The above snap shows a demo application with three services and a traffic
generator named wavepool-generator. Let's examine the service topology that
we're following in this demo.
Service Topology
The demo application is an example of a microservices' topology, where requests
flow from service1 to service2 and from service2 to service3. Each
service adds a delay with a jitter to simulate processing. Service 3 is an
upstream service that's configured with an artificial concurrency limit to
simulate overload scenarios. Now, let's discuss the traffic pattern.
Traffic Pattern
The traffic generator is designed to create a symmetrical traffic load for three types of users: premium, subscriber, and guest. Essentially, the load generator alternates between regular traffic and high-traffic scenarios periodically.
Load Generator
This configuration will generate the following traffic pattern:
- Ramp up to
5concurrent users in10s. - Hold at
5concurrent users for2m. - Ramp up to
30concurrent users in1m(overloadsservice3). - Hold at
30concurrent users for2m(overloadsservice3). - Ramp down to
5concurrent users in10s. - Hold at
5concurrent users for2m.
Deploying Aperture Policies for Workload Prioritization
📖 Before diving into policies, please go through the Concepts. This will help you better understand the demo.
For this demo, we will be extending the
Basic Concurrency Limiting
policy to demonstrate workload prioritization. Since the policy has a
Concurrency Limiter Actuator, it allows us to shed some "less useful" requests
while minimally impacting the "more important" ones using the scheduler. This
scheduler is based on
Weighted Fair Queuing
and helps us in prioritizing requests based on flow labels. You can read more
about it here.
💡 Each Flow
(Fundamental unit of work from the perspective of an Aperture Agent. It could be
an API call, a feature, or even a database query) has a set of Flow Labels,
which are a pair of key: value. For example, if a Flow is annotated with the
label user_tier: gold, user_tier would be the label key, and gold would be
the label value.
The policy is configured to measure the service latency of service3via
Flux Meter,
and that signal is used to detect an overloaded state. The concurrency limiter
is deployed on service1, which is the downstream service (see
Service Topology). This ensures that when service3 is
overloaded, we stop accepting additional requests at the entry point, i.e.,
service1, to avoid wasted work.
Let's begin by generating a policy configuration and resources.
Installing aperturectl
Before generating the values.yaml file, which contains policy configuration
details, we need to set up
aperturectl
on our local machine. Since this demo is running on a Linux machine, we can use
the following command to install aperturectl:
brew install fluxninja/aperture/aperturectl
aperturectl is a command-line tool that helps generate a values.yaml file,
similar to Helm's values.yaml. It also generates the policy, circuit diagram,
and Grafana dashboard JSON that we will see later on.
Generate values.yaml
To generate values.yaml based on Latency AMID Concurrency Limiting Blueprints,
run the below command.
aperturectl blueprints values --name=policies/latency-aimd-concurrency-limiting --version=v0.25.2 --output-file=values.yaml
To prioritize traffic for different users, such as premium, subscribed, and guest, we need to classify requests based on common attributes using the Flow Classifier.
First, let's classify the requests based on common attributes, then we can define workload priority under the scheduler configuration. To extract values from metadata, there are two ways shown in this demo:
- Use the provided extractor to extract values, such as extracting values from headers.
- Rego expressions: If you need to handle advanced use cases, such as extracting a field from a JSON-encoded request payload or parsing JWT tokens, you can write your own extractor using Rego expressions. For more information on extractors, see the documentation.
Here is the classifier configuration using Rego and extracting values from headers using the extractor in the final values.yaml file.
- aperturectl values.yaml
# yaml-language-server: $schema=file:/home/sudhanshu/.aperturectl/blueprints/github.com_fluxninja_aperture_blueprints@v0.25.2/github.com/fluxninja/aperture/blueprints/policies/latency-aimd-concurrency-limiting/gen/definitions.json
# Generated values file for policies/latency-aimd-concurrency-limiting blueprint
# Documentation/Reference for objects and parameters can be found at:
# https://docs.fluxninja.com/development/reference/blueprints/policies/latency-aimd-concurrency-limiting

common:
  # Name of the policy.
  # Type: string
  # Required: True
  policy_name: "service1-demo-app"

policy:
  # Flux Meter.
  # Type: aperture.spec.v1.FluxMeter
  flux_meter:
    flow_selector:
      service_selector:
        # Service Name.
        # Type: string
        # Required: True
        service: service3-demo-app.demoapp.svc.cluster.local
      flow_matcher:
        # Control Point Name.
        # Type: string
        # Required: True
        control_point: ingress
  # List of classification rules.
  # Type: []aperture.spec.v1.Classifier

  # Here is the classifier configuration using Rego
  # and extracting values from headers using the extractor.
  classifiers:
    - flow_selector: &concurrency_flow_selector
        service_selector:
          service: service1-demo-app.demoapp.svc.cluster.local
        flow_matcher:
          control_point: ingress
      rules:
        user_type:
          extractor:
            from: request.http.headers.user-type
        user_data_from_cookie:
          rego:
            query: data.user_from_cookie.user
            source: |
              package user_from_cookie
              cookies := split(input.attributes.request.http.headers.cookie, "; ")
              user := user {
                  cookie := cookies[_]
                  startswith(cookie, "session=")
                  session := substring(cookie, count("session="), -1)
                  parts := split(session, ".")
                  object := json.unmarshal(base64url.decode(parts[0]))
                  user := object.user_type
              }
  # List of additional circuit components.
  # Type: []aperture.spec.v1.Component
  components: []
  concurrency_controller:
    # Concurrency Limiter flow selector.
    # Type: aperture.spec.v1.FlowSelector
    flow_selector: *concurrency_flow_selector
    # Scheduler parameters.
    # Type: aperture.spec.v1.SchedulerParameters

    ## workload Priorities are defined here.
    scheduler:
      default_workload_parameters:
        priority: 20
      workloads:
        - label_matcher:
            # match the label extracted by classifier
            match_labels:
              user_type: "guest"
          parameters:
            priority: 170
        - label_matcher:
            # match the label extracted by classifier using rego expressesion
            match_labels:
              user_data_from_cookie: premium
          parameters:
            priority: 255
        - label_matcher:
            # match the http header directly
            match_labels:
              http.request.header.user_type: subscriber
          parameters:
            priority: 245
    default_config:
      dry_run: false
    # Type: float64
    load_multiplier_linear_increment: 0.0009
Generate Aperture Policy Resources
To generate resources related to Aperture Policy, such as the Kubernetes Custom
Resource, Grafana Dashboards, and graphs in DOT and Mermaid formats, we will use
the previously generated values.yaml file that we have modified to fit our
specific needs.
Run the below command to generate resources.
aperturectl blueprints generate --name=policies/latency-aimd-concurrency-limiting --values-file values.yaml --output-dir=policy-gen --version=v0.25.2
The following resources will be generated with this command —
$ tree policy-gen
policy-gen
├── dashboards
│   └── service1-demo-app.json
├── graphs
│   ├── service1-demo-app-cr.dot
│   └── service1-demo-app-cr.mmd
└── policies
    ├── service1-demo-app-cr.yaml
    └── service1-demo-app.yaml

3 directories, 5 files
Generated Policy
Generating Signal Dashboard
Just as we generated values.yaml and the policy resource, we can generate a
Signal dashboard using aperturectl.
Generate values.yaml
To generate values.yaml for the Signal dashboard, run the following command:
aperturectl blueprints values --name=dashboards/signals --version=v0.25.2 --output-file=values.yaml
- values.yaml
# yaml-language-server: $schema=file:/home/sudhanshu/.aperturectl/blueprints/github.com_fluxninja_aperture_blueprints@v0.25.2/github.com/fluxninja/aperture/blueprints/dashboards/signals/gen/definitions.json
# Generated values file for dashboards/signals blueprint
# Documentation/Reference for objects and parameters can be found at:
# https://docs.fluxninja.com/development/reference/policies/bundled-blueprints/dashboards/signals

common:
  # Name of the policy.
  # Type: string
  # Required: True
  policy_name: "service1-demo-app"

dashboard:
  # Refresh interval for dashboard panels.
  # Type: string
  refresh_interval: "5s"
  # From time of dashboard.
  # Type: string
  time_from: "now-15m"
  # To time of dashboard.
  # Type: string
  time_to: "now"
  datasource:
    # Datasource name.
    # Type: string
    name: "$datasource"
    # Datasource filter regex.
    # Type: string
    filter_regex: ""
Generate Dashboard Resources
Use generated values.yaml to generate the Signal dashboard resource.
aperturectl blueprints generate --name=dashboards/signals --values-file values.yaml --output-dir=dashboard-gen --version=v0.25.2
The tool will generate a Grafana Dashboard JSON file that can be imported into the playground instance within Grafana.
dashboard-gen
└── dashboards
    └── service1-demo-app.json

1 directory, 1 file
Applying Policy and Load Dashboards
Aforementioned, we have a playground setup that includes Aperture, which you can set up following Try Local Playground guide.
Once you have completed the playground prerequisite, run the playground using the following command. Ensure to navigate to the playground directory within the cloned aperture repository on your local machine.
cd playground
tilt up -- --scenario=./scenarios/demo-app-with-no-policy
👉 Verify all the resources in tilt are up and running
Apply policy
The policy can be applied using aperturectl or kubectl. Both ways are
correct, but we recommend using aperturectl.
⚠️ The policy needs to be applied in the aperture-controller namespace, where
the Aperture Controller is running.
For this demo, we will use aperturectl to apply.
aperturectl apply policy --file=policy-gen/service1-demo-app-cr.yaml
Loading Grafana Dashboards JSON
To load the dashboard generated with policy, follow these steps:
- In the Grafana UI (at
http://localhost:3000/), navigate to Dashboards → Browse from the left-side panel. - Click on New → Import.
- Upload the dashboard JSON by clicking on Upload JSON file.
- Click on Import, and you will be redirected to the dashboard.
Following these steps, we will upload Signal Dashboard and Policy Dashboards into the Grafana Instance running in the playground setup.
Classifier and Prioritization
Flow Classifiers are used to inject additional flow labels without any changes to your service, which helps bring more options in flow control. They are defined as a resource in a policy. Read more about how to create Flow Labels.
By using these flow labels, it's easy to classify traffic and prioritize it. In the code snippet above, the 'classifiers' array contains details about a classifier with a flow selector, a concurrency limiter flow selector, and two rules. This classifier has two rules, one of which extracts a value directly from the headers, and the other uses a regular expression to extract user data from cookies.
Both of these rules will be available as flow labels: user_type and
user_data_from_cookie.
Once these flow labels are available, it is easy to assign priorities to each
Flow Labels using Flow Matcher in workload configurations. Therefore,
enabling prioritization.
Challenges without Workload Prioritization
Without workload prioritization, there is a risk that important requests will be
discarded along with less important ones when the system is overloaded. This
could lead to wasted work and a decline in overall system performance. Let’s see
what happens when service3 is overload.
Using the Grafana dashboard provided by Aperture, the latency of service3 (In
this case, Aperture policy is running in
dry run
mode) can be easily monitored.
Traffic ramping up
When the traffic generator increases users, the latency of service3 under the
Flux Meter panel goes up to 220ms from its normal 60ms. These sudden
latency spikes could lead to a poor user experience and eventually, client
timeout, rendering the service unavailable. This could cause a cascading failure
throughout the application.
The lack of workload prioritization and the excessive requests from guest users result in consequences such as high latency and request timeout for subscribed and premium users. In the workload latency panel, all workloads have similar latency, which means that premium users' requests are being rejected similarly to subscribed and guest users. This gets even more problematic when we consider a company with tiers for each API request; premium users ought to have higher priority.
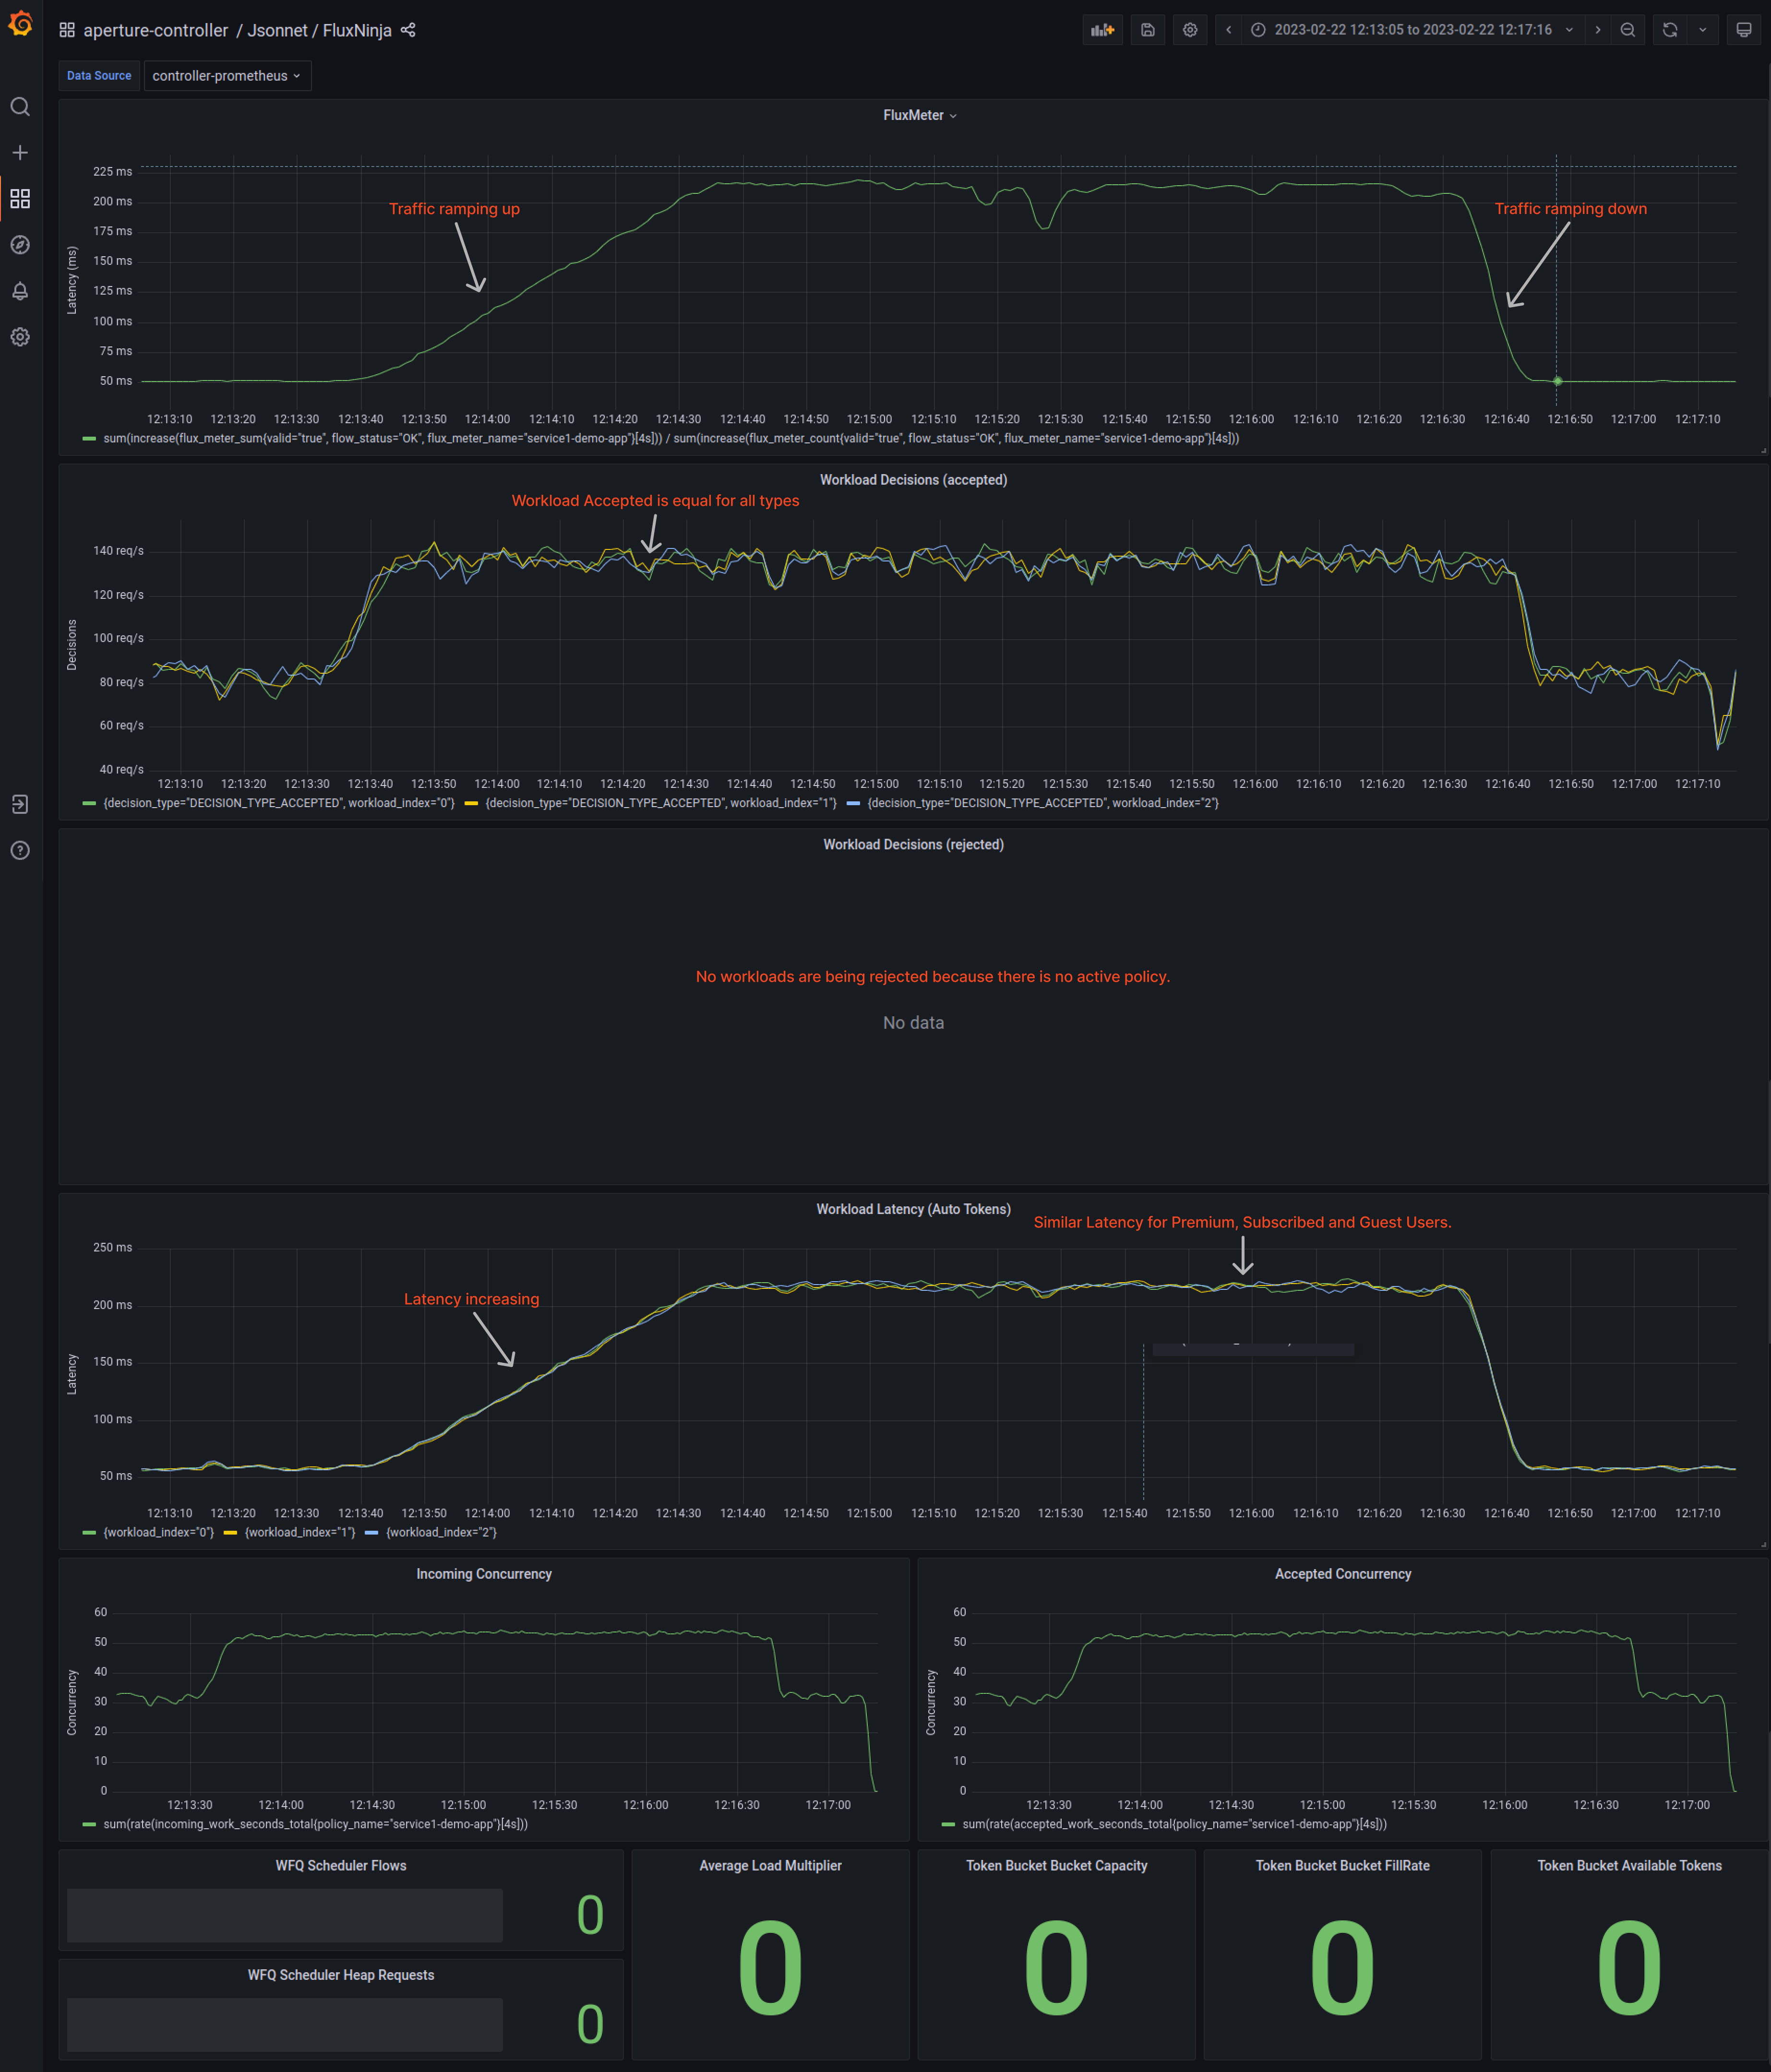
Figure 1 shows the workload latency panel. All workloads have similar latency, the Aperture policy is not active, and no workload prioritization is currently occurring.
Workload Prioritization with Aperture
Once Aperture becomes active, it will start processing all signals, including
latency. This processing of signals happens via
circuit components.
To visualize these signals, Aperture provides a Signal Dashboard available under
aperture-controller inside Grafana. These signals are passed through a
circuit, converting signals into control decisions.
Circuit Diagram of the Policy
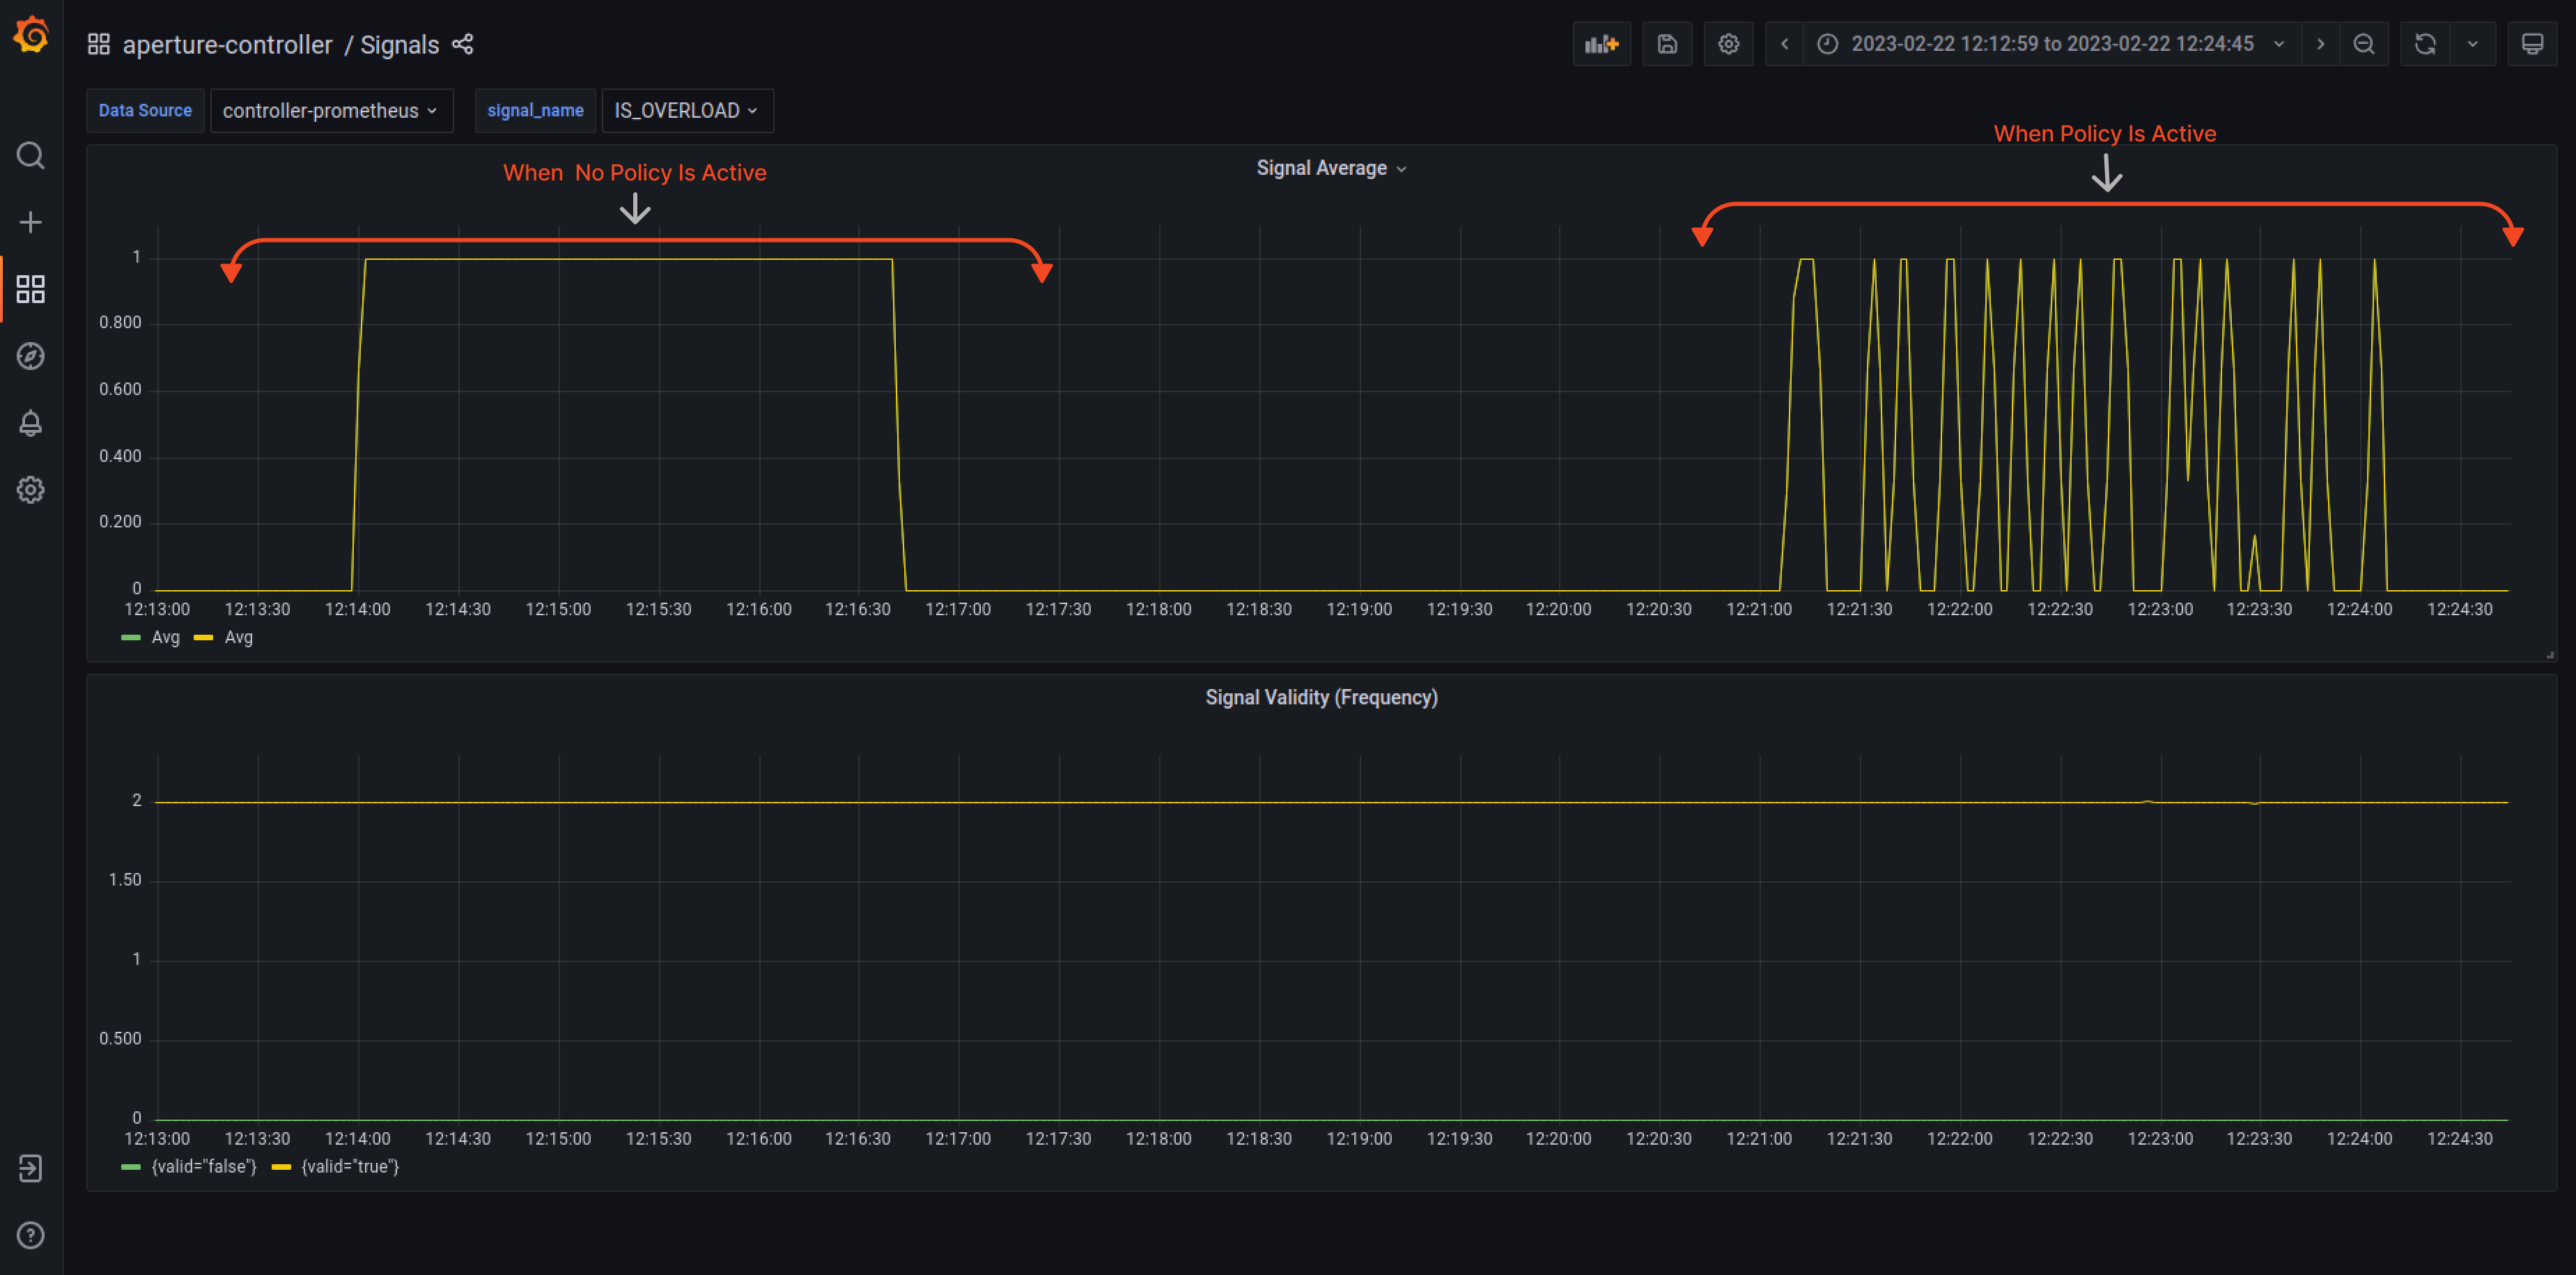
Figure 3 shows the IS_OVERLOAD signal when the Aperture policy is active.
In the dashboard above, we can see that the IS_OVERLOAD signal indicates service overload when there is no workload prioritization or aperture active. In the second half, we observe a Sawtooth pattern, which is expected when "brakes" are applied to optimize for maximizing Goodput. Aperture tries to determine whether the overload condition is under control or if it needs to shed more load to maintain control.
Under Normal Traffic Conditions, latency hovers around 55ms. Aperture learns the baseline latency by doing an exponential moving average on latency readings. To track incoming traffic, check out the “Incoming Concurrency” panel, and for accepted traffic, check the “Accepted Concurrency” panel, as shown below in the snapshot.
Guest, Premium, and Subscriber workloads shown on indices 0, 1, and 2, respectively, have equal acceptance rates in the “Workload Decisions” panel, as there are no traffic drops during normal loads at the start. Even the latencies are equal.
Aperture estimates the cost of each workload and prioritizes them based on request attributes to ensure fair scheduling during overload scenarios. Premium users have the highest priority, followed by subscribed users and then guests. This helps with workload prioritization and can be tracked in the "Workload Latency" panel.
When traffic is ramping up
When traffic generators ramp up the number of concurrent users, service3 may
become overloaded, increasing latency. Aperture detects this latency spike and
immediately limits concurrency on service1. Aperture optimizes the load while
prioritizing individual workloads based on the
priorities
configured in the policy. Premium workloads are given priority to oversubscribed
workloads, which in turn are given priority over guest users.
During the spike in traffic, Aperture automatically adjusts the "Accepted
Concurrency" by flattening the graph. Eventually, as the traffic ramps down,
both "Incoming Concurrency" and "Accepted Concurrency" graphs return to normal.
In the Flux Meter panel, it is visible that the latency on service3 is being
maintained within the configured tolerance level, ensuring the service remains
responsive throughout the traffic spike.
When traffic is decreasing
The traffic spike is subsiding as the traffic rate goes down to normal levels. In the background, the Latency AIMD Concurrency Limiting Policy will keep load shedding to maintain its safe concurrency limit and priority of workloads, a limit where the service is not overloaded.
Once the service is no longer overloaded, the Aperture Policy will try to increase the concurrency limit of the service periodically, leading to maximum acceptance rates of requests for individual users.
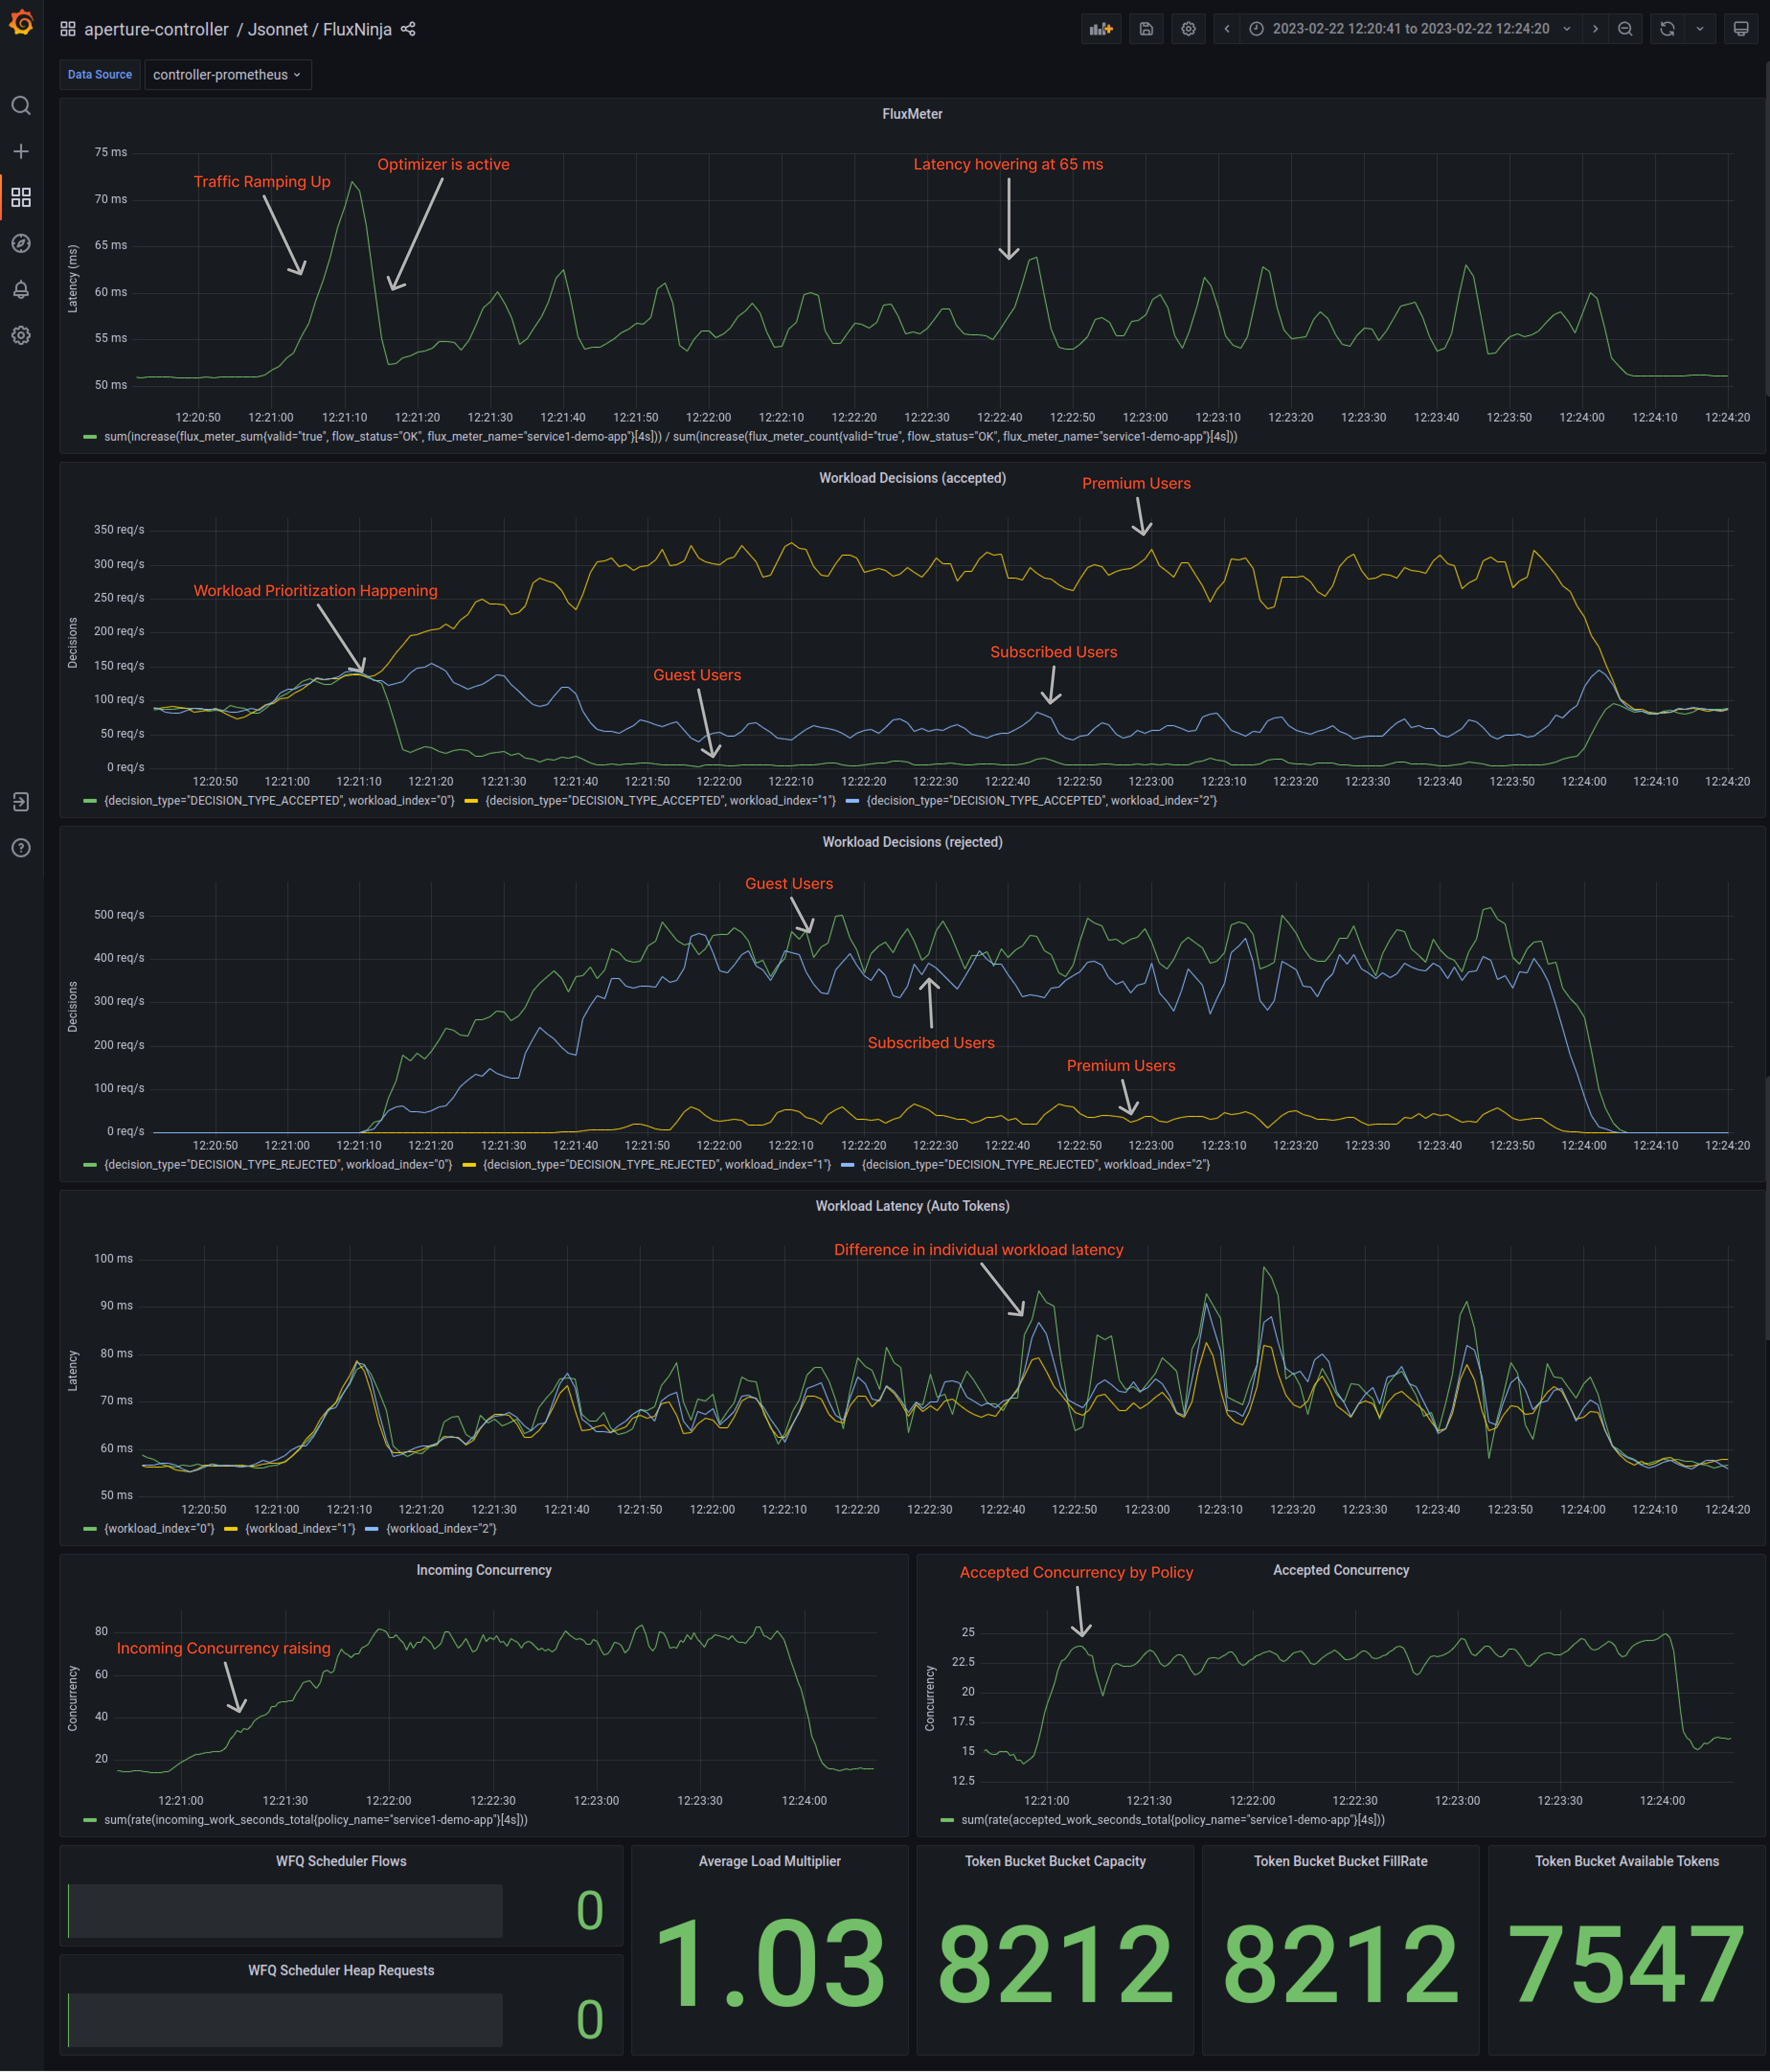
Figure 4 shows the workload prioritization when the Aperture policy is active.
Aperture enables the system to work well even in difficult circumstances, such as high traffic surges or bugs, by prioritizing workloads and handling large numbers of requests while maintaining a good user experience. Without Aperture, the system may fail when faced with adverse conditions, leading to a bad user experience and potential loss of revenue for the company.
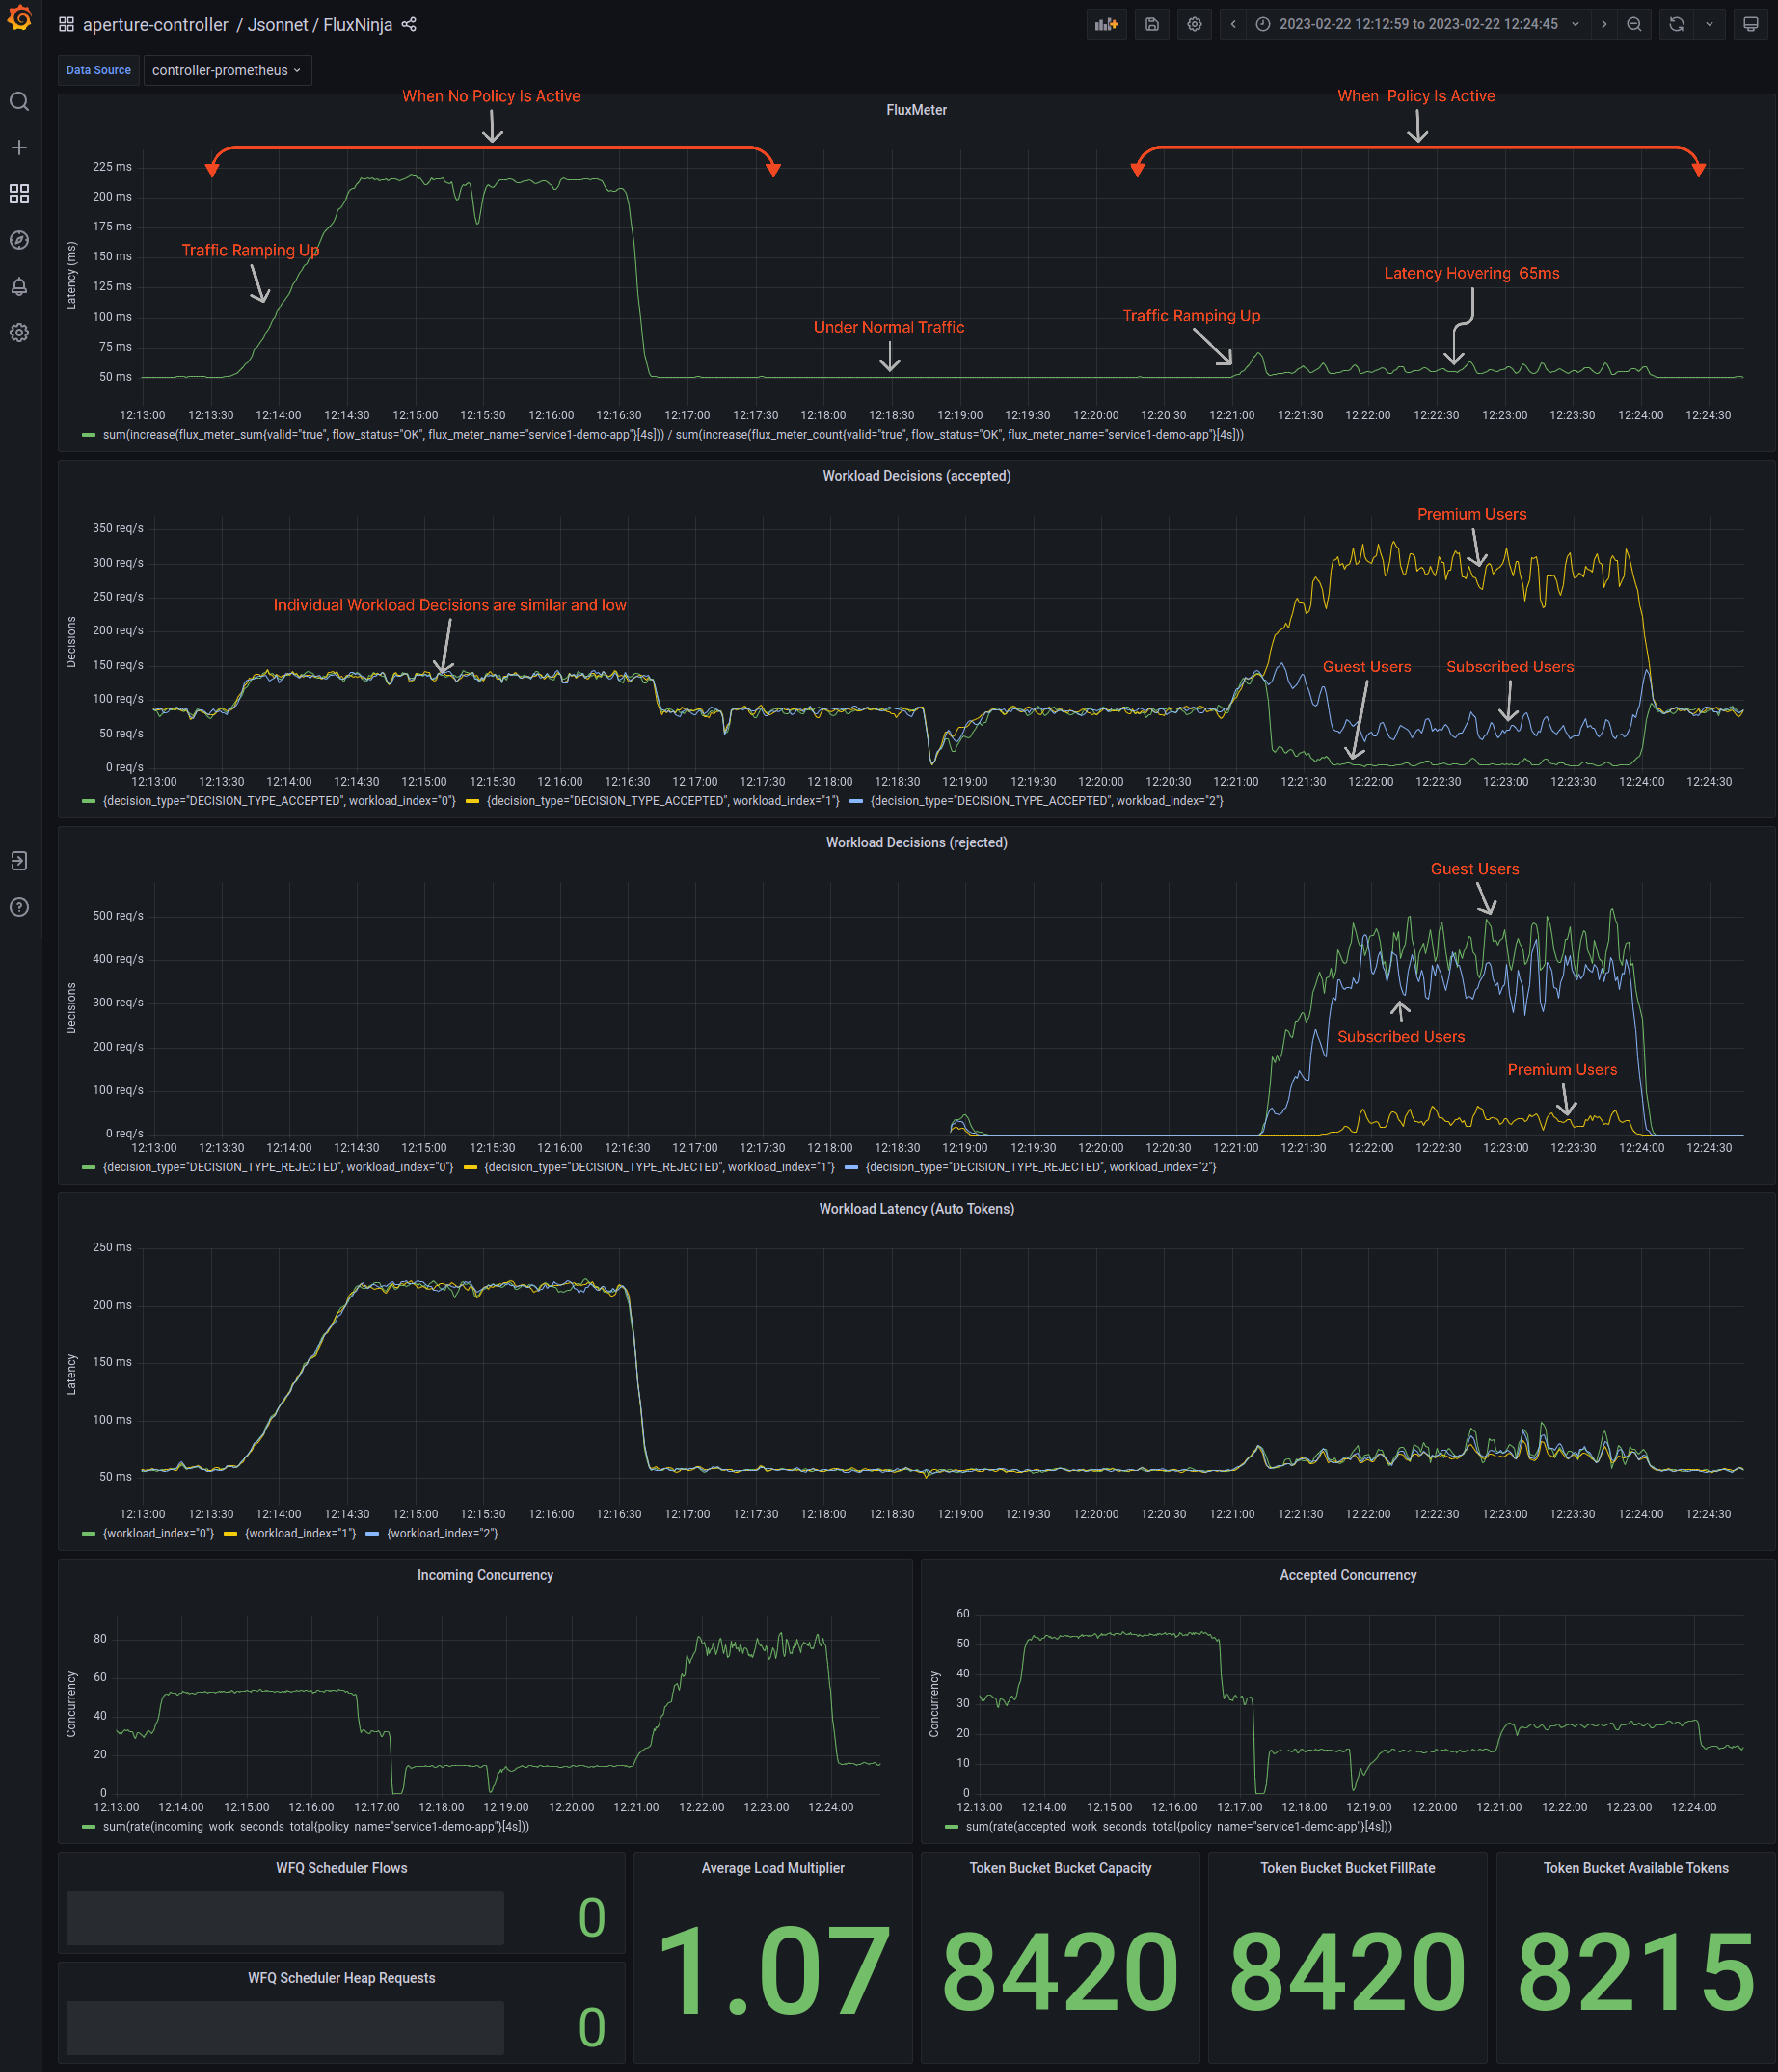
Figure 5 showed an across-the-board overview of workload latency when no workload prioritization occurred, compared to when Aperture performed workload prioritization.
Overall, there is an enormous difference when Aperture comes into the picture. It controls the flow of requests and maintains workload priorities when traffic is ramping up. With Aperture active, latency significantly remains under range for individual workloads.
Conclusion
In conclusion, Aperture is an essential tool for achieving graceful degradation in your services. By deploying Aperture policies for workload prioritization and implementing flow control concepts, you can ensure that your system can handle a large volume of incoming requests while still providing a good user experience. With Aperture, you can avoid downtime, minimize the impact of bugs, and keep your system running smoothly even in adverse conditions. So, if you want to ensure the reliability and availability of your services, consider using Aperture as part of your reliability management strategy.
To learn more about Aperture, visit our GitHub repository and documentation site. Join our vibrant Discord community to discuss best practices, ask questions, and engage in insightful discussions with like-minded individuals. For another interesting read, you can check out our blog post, Why Your Service Needs Adaptive Concurrency Limits.