

Over the last decade, significant investments have been made in the large-scale observability systems, accompanied by the widespread adoption of the discipline of Site Reliability Engineering (SRE). Yet, an over-reliance on observability alone has led us to a plateau, where we are witnessing diminishing returns in terms of overall reliability posture. This is evidenced by the persistent and prolonged app failures even at well-resourced companies that follow the best practices for observability.
Furthermore, the quest for reliability is forcing companies to spend ever more on observability, rivaling the costs of running the services they aim to monitor. Commercial SaaS solutions are even more expensive, as the unpredictable pricing models can quickly skyrocket the observability bill. The toll isn't only monetary; it extends to the burden shouldered by developers implementing observability and operators tasked with maintaining a scalable observability stack.
The paradox lies in the fact that even with substantial investments and resource allocation aimed at improving observability, meaningful gains in reliability have yet to be achieved.
Such a situation necessitates a new approach and a shift in the industry's trajectory. At Netsil (acquired by Nutanix), an observability company we founded, and now at FluxNinja, we've seen this paradox play out repeatedly. Drawing on insights from our decade-long journey, interactions with hundreds of teams, and firsthand experiences with outages, we aim to dissect this paradox, delve into its underlying causes, and suggest a future direction for the industry.
However, to truly appreciate the problem, it's essential to step into the shoes of those on the front lines: the Site Reliability Engineers (SREs). They grapple with the complexities of modern applications, trying to maintain a balance between rapid innovation and system stability. Let's examine the SRE workflow to understand the challenges they face.
Operating Modern Applications: The "real-world" SRE Workflow
Web-scale companies tend to decompose their applications into services to enable independent development and deployment. Even without full-blown microservices' adoption, modern applications rely on numerous "external" services, such as cloud provider managed services, self-hosted databases, caches and so on. Though this decomposition has enabled rapid innovation, the complexity has made modern applications inherently fragile and prone to cascading failures due to larger surface area for failures.
For example, even a minor overload in one service can push the entire application into an unstable state. These failures, which can rapidly get out of hand, are increasingly common and reinforce the need for specialized teams to operate these applications.
Google staff famously wrote the Site Reliability Engineering book, which has become a "bible" for SRE practices. The book outlines a workflow for SRE, which seemingly works well for Google. However, we are yet to meet a team in practice that follows the "ideal" workflow. The "real-world" SRE workflow is far more operational and reactive.
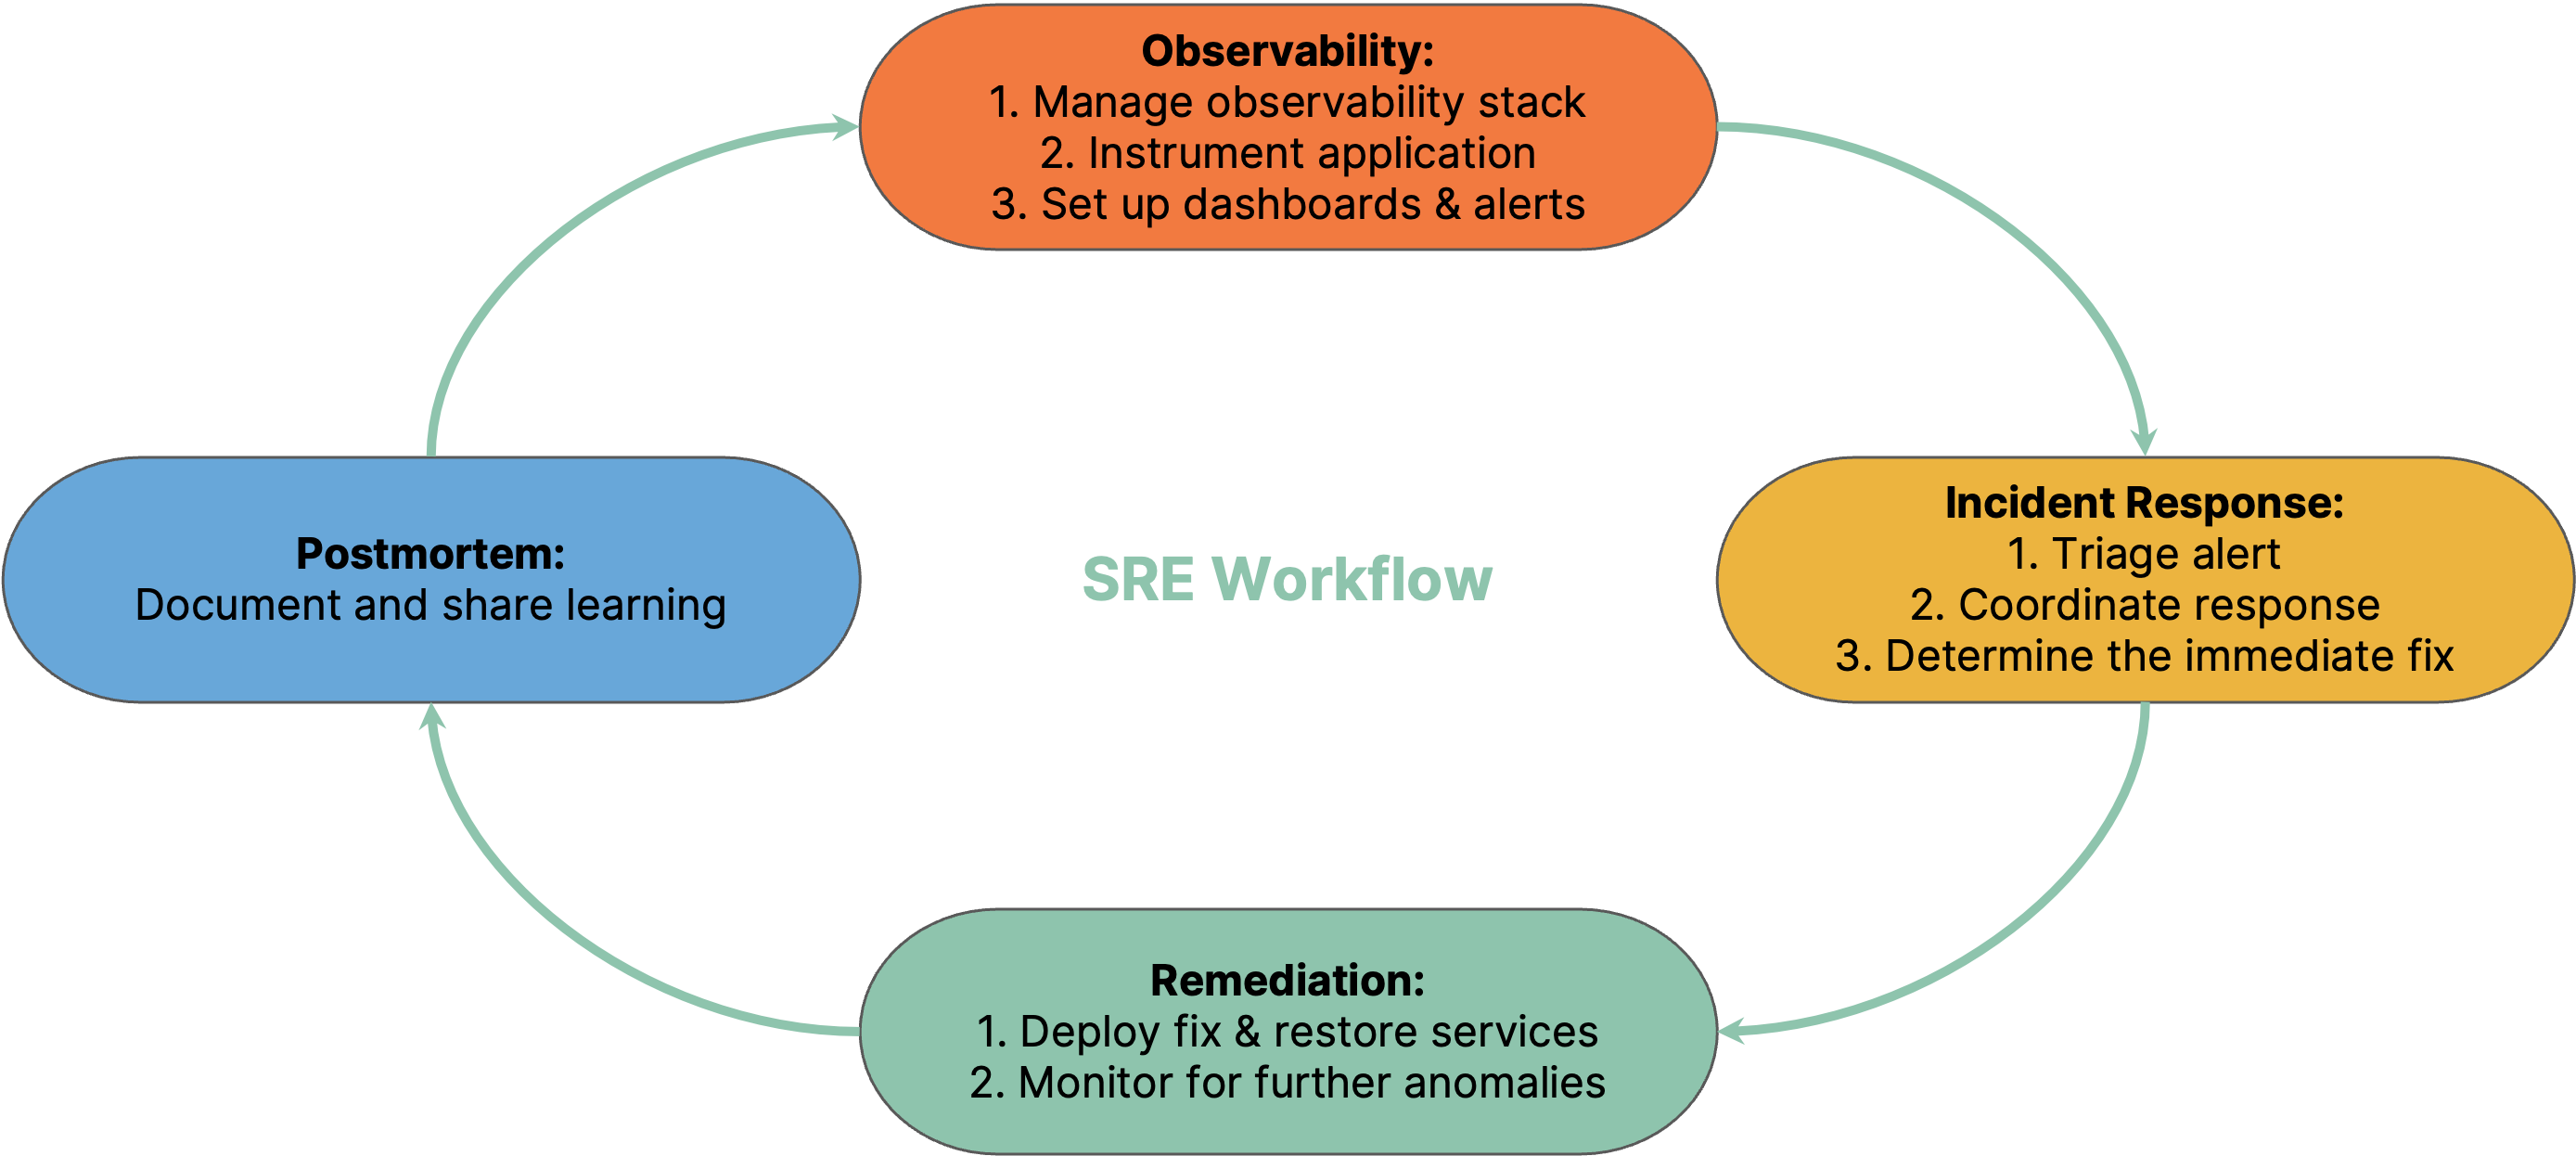
The above diagram illustrates the typical stages of the "real-world" SRE workflow. SRE teams are responsible for setting up and managing the observability infrastructure to collect, store, and query data. SREs along with development teams instrument the application to gather metrics, logs, and traces from not only their services but also the underlying infrastructure and any external services. To make sense of this data, dashboards are set up for visual analysis, and alerts are established to notify the team of any anomalies or issues.
When an incident arises, the team first triages the alerts, assessing their severity and impact. Next, they determine the immediate fix to contain the blast radius. After implementing the fix, they continuously monitor the system to ensure no further anomalies arise. Post-incident, the team documents the incident, detailing its cause, the steps taken for its resolution, and the lessons learned. Often, the postmortem analysis reveals areas that need more attention, leading the team back to the observability phase, where they might add more instrumentation and establish new alerts.
All this operational work leaves these teams with little time to focus on applying systems thinking and software engineering practices to improve the application's reliability. Increasingly, the SRE teams seem to be stuck in a vicious cycle of firefighting while setting up even more monitoring and alerting, leading to fatigue and burnout.
Is Observability++ an answer?
We have been keeping a pulse on all the latest developments in this space for the last several years. In terms of observability tools, the ecosystem is extensive and varied.
Here's a partial list of observability tools:
| Area of Observability Stack | Open Source and Self-Hosted Solutions | SaaS Solutions |
|---|---|---|
| Collection (Scrapers, Tracing, Profiling) | Prometheus, OpenTelemetry Collector, Pixie (eBPF), Polar Signals(eBPF) | Datadog, New Relic, Splunk |
| Time-Series Databases (Metrics) | Prometheus, Cortex, Thanos, M3DB, InfluxDB | Datadog, CloudWatch, Chronosphere |
| OLAP Databases (for Logs and Traces) | ClickHouse, Druid, Elasticsearch | Datadog, Honeycomb |
| Dashboards & Alerting Systems | Grafana, AlertManger | Datadog, Honeycomb, Splunk |
| Incident Response Platforms | Grafana, Cabot | PagerDuty, Jeli.io, incident.io, FireHydrant |
At a high-level, most of the startups and open source initiatives are focused on speeding up some aspects of the above-mentioned areas and the SRE workflow:
- Continuous profiling: eBPF based tools such as Pixie, Pyroscope, Parca have enabled low-friction and low-overhead profiling of applications in production.
- Data Tiering: Most cost reduction efforts center around adding tiering to observability data storage. For example, it's much cheaper to store high-volume, high-cardinality profiling data in a local in-memory OLAP tier closer to the workloads to assist with real-time debugging than to send to a centralized service. Example tools include FrostDB, bitdrift and Last9.
- Unified data platforms: Databases such as Influx IOx are combining metrics, logs, and traces into a unified data platform to reduce the cost of observability by reducing the number of systems to manage.
- Generative AI: There are massive investments being made in applying Large Language Models to assist with incident response and root cause analysis. For example, observability companies are rapidly introducing natural language interfaces to query observability data and provide prescriptive suggestions during incident response.
While these technologies are promising and can make observability somewhat cost-effective, they don't fundamentally change the reliability posture.
Controllability: The other side of the coin
We started FluxNinja with the belief that the path to solving for reliability starts with controllability. The purpose of controllability is to stabilize complex systems using closed-loop feedback. Controllability and observability are dual aspects of the same problem. While observability deals with understanding the system state, the concept of controllability is about continuously making adjustments to the system to ensure stable behavior without manual intervention. The right control strategy makes sure that the system remains within safe operational bounds, ensuring quick recovery from small failures and significant reduction of prolonged outages. It is important to point out that controllability is distinct from open loop orchestration tools such as Terraform that converge the system to a desired state.
A controllable system is composed of three parts:
- Control Surfaces: These are the knobs and dials that can be used to control the system behavior.
- Observability: The system needs to be observable to understand the current state and the impact of the control surfaces in real time.
- Closed-loop Controller: This is the brain of the system that continuously monitors the system state and makes adjustments to the control surfaces to ensure stable behavior. Controllers typically use a feedback loop, such as those based on the PID control algorithm.
For reliable operation, controllability is required at each layer of the stack (VMs/pods/containers, clusters, services). Let's examine a few familiar examples:
- Instance-level control: The most common form of control uses an instance-level vantage point to make localized decisions. For example, Kubernetes provides a set of probes that can be used to restart pods when they fail and Istio provides circuit breakers that can be used to protect upstream services. Such controls are easy to implement, but are effective only in limited scenarios. For example, pod restarts are effective against unrecoverable failures such as deadlocks in code. But if used incorrectly, pod restarts can lead to cascading failures.
- Service-level control: As compared to instance-level control, service-level control uses an aggregated view of the service instances to make adjustments. For example, Kubernetes Horizontal Pod Autoscaler uses aggregated saturation metrics like CPU utilization to adjust the number of pods. While service-level control helps stabilize the service, it might shift the problem elsewhere in the service chain and prolong the recovery.
While existing control systems are a good start, they are underdeveloped and limited. Here are some notable gaps:
- Lack of coordinated control: While control at a specific layer brings stability within that layer, it is often ineffective in ensuring stability in higher layers. To bring controllability to higher layers of abstraction such as an entire application, regions and so on, there is a need for an observability-driven control plane that can detect stability issues across layers and make coordinated adjustments to the control surfaces. For instance, throttling request rates at the gateway services when the database is overloaded. Or, load balancing traffic across multiple regions to prevent a single region from being overwhelmed.
- Lack of control surfaces: Investing in new control surfaces such as flow control can drastically improve the reliability posture. Most reliability problems can be traced to a mismatch in demand vs provisioned capacity. Unlike circuit breaking or pod restarts which make the transition between drastic on/off states, flow control allows for graceful degradation with continuous corrections. Examples of flow control include service-level load shedding, adaptive rate limiting, request prioritization and so on. Flow control can be a competitive advantage, and companies like Netflix stay competitive by drastically reducing outages using techniques such as prioritized load shedding.
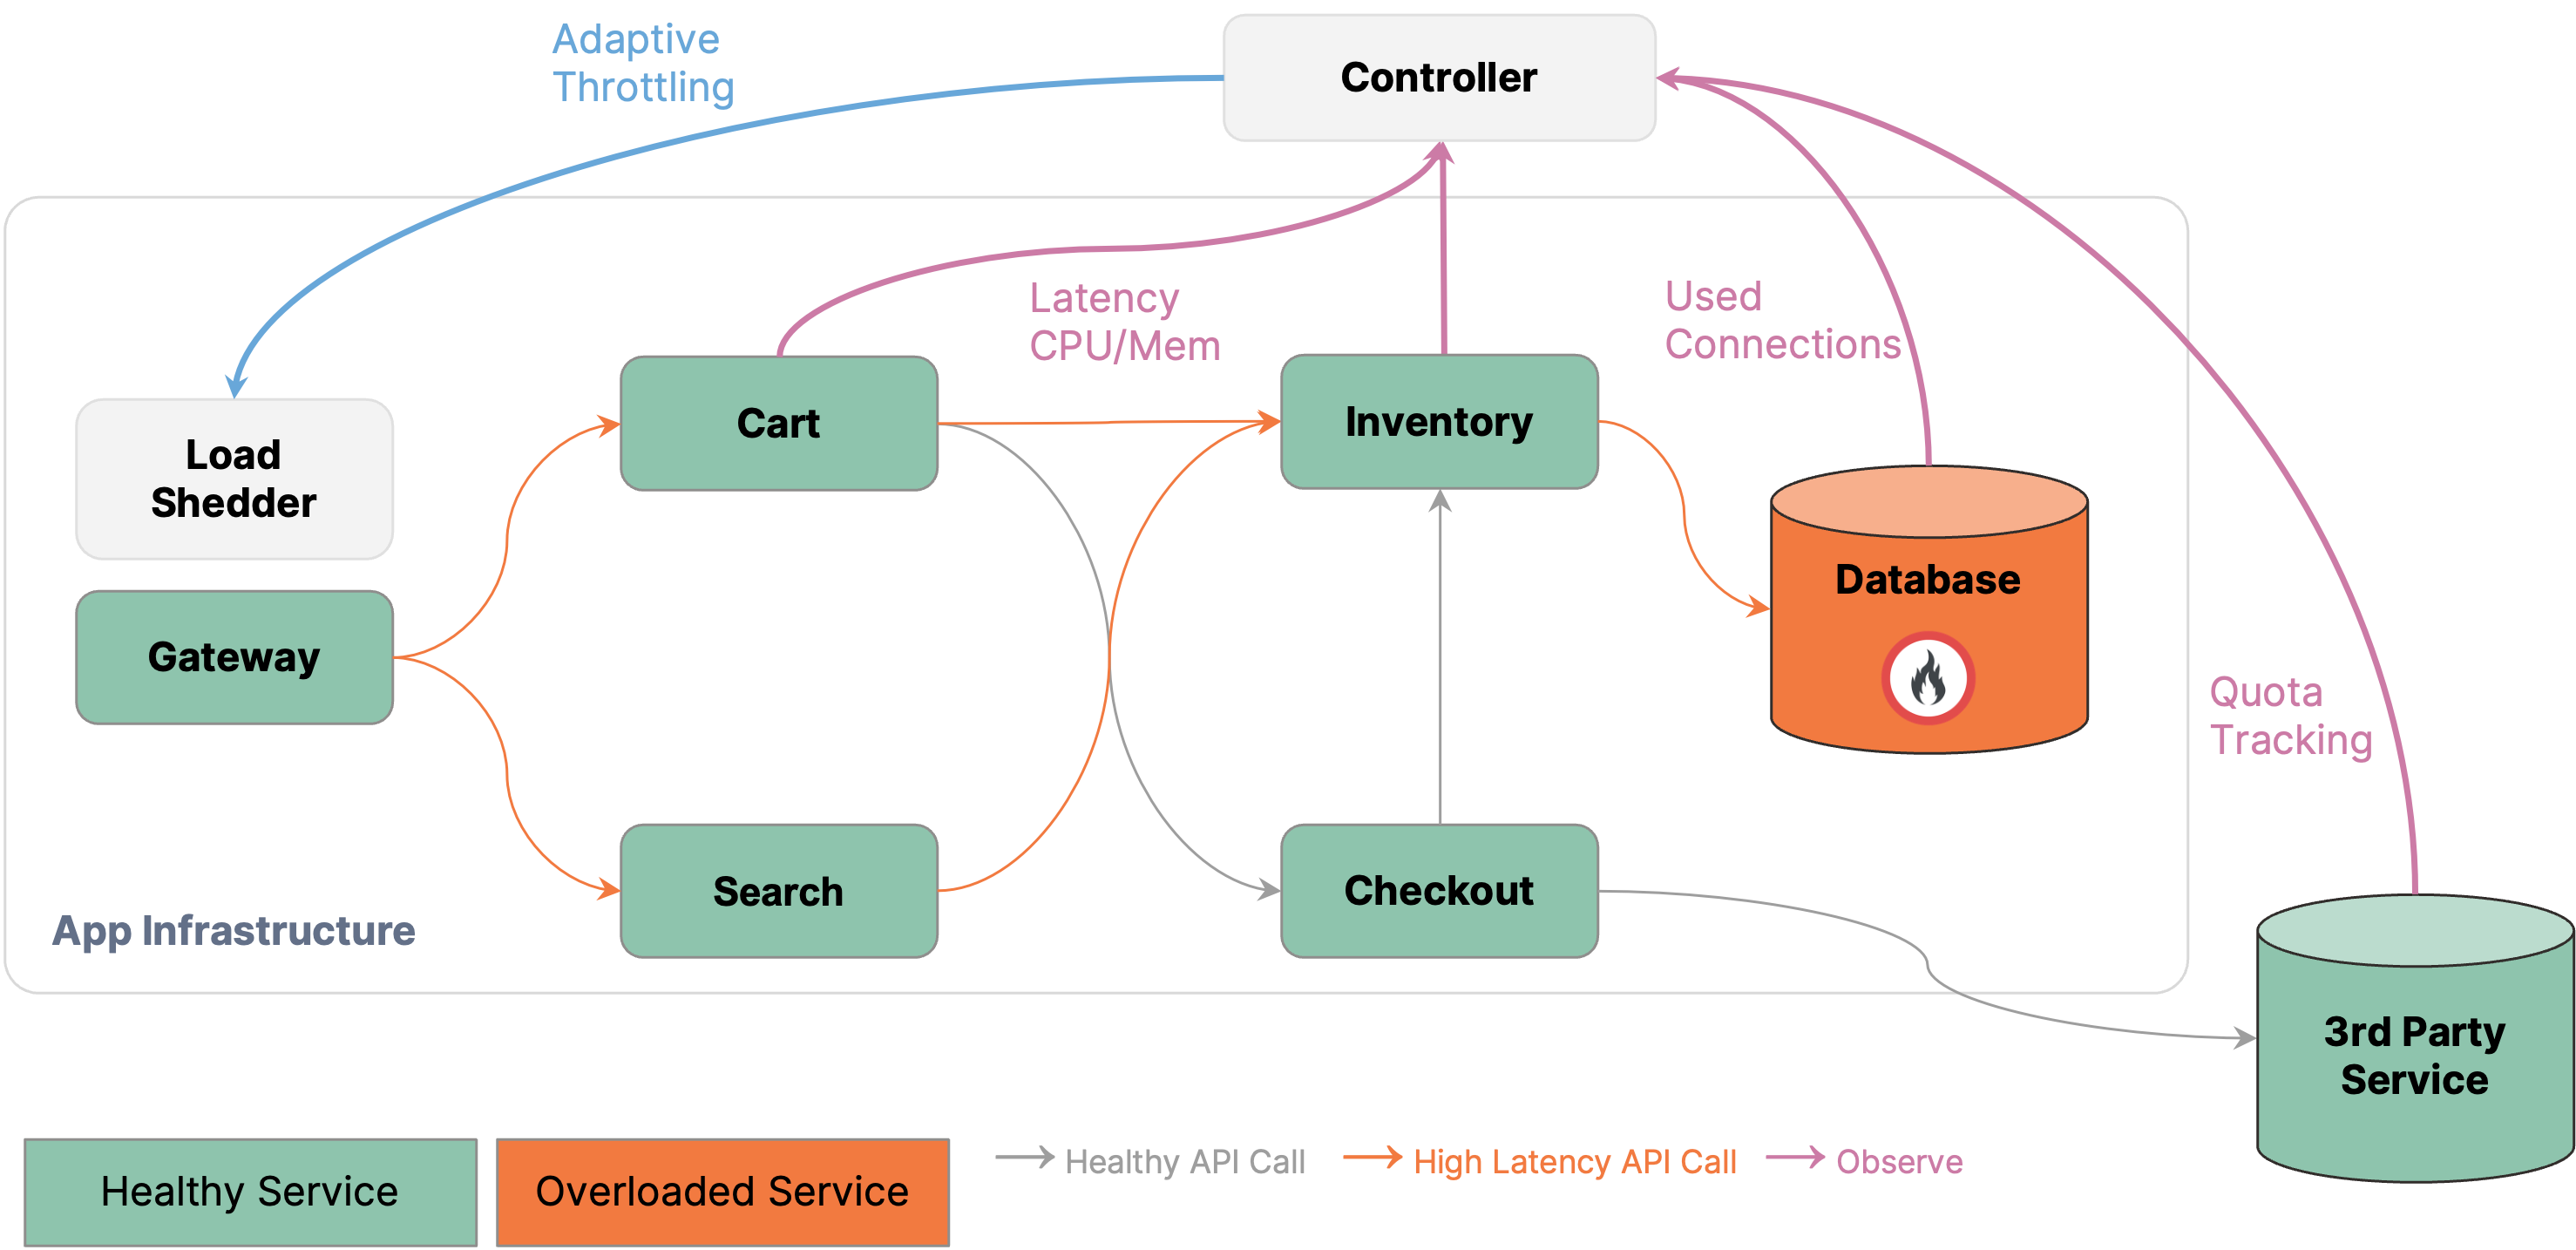 Coordinated control: Adaptively load shedding API calls at the gateway based on
database health signals.
Coordinated control: Adaptively load shedding API calls at the gateway based on
database health signals.
Bridging the Controllability Gap with FluxNinja Aperture
At FluxNinja our aim is to fill the controllability gap with a new class of control surfaces and a centralized control plane. We laid the foundation with the open source FluxNinja Aperture project to democratize and collaboratively build the next generation of observability-driven control platforms.
With Aperture, we have innovated in a couple of key areas:
- Flow control surfaces: Aperture provides a new class of control surfaces that can be used to regulate the flow of traffic to and from services. It includes a request scheduler that throttles the request rate while prioritizing requests based on importance. Aperture also includes a distributed rate limiter that can be used to ensure fairness across users.

 Aperture's request scheduler: Token bucket and weighted fair queueing-based
scheduler throttles the request rate while prioritizing requests based on
importance.
Aperture's request scheduler: Token bucket and weighted fair queueing-based
scheduler throttles the request rate while prioritizing requests based on
importance.
- Programmable controller: Aperture provides a centralized controller to execute policies, which are defined as circuits composed of signal processing blocks that establish control loops. The controller can track health signals from multiple sources, react to them, and even escalate actions to other systems. The key idea is to decouple observability from control surfaces through the use of these circuits. For example, Aperture's policies can be used to track the health of upstream services, such as databases, and react to overload buildup by throttling the request rates at the gateway services. In addition, the same policy can trigger escalation actions such as auto-scaling or switching off non-critical features.
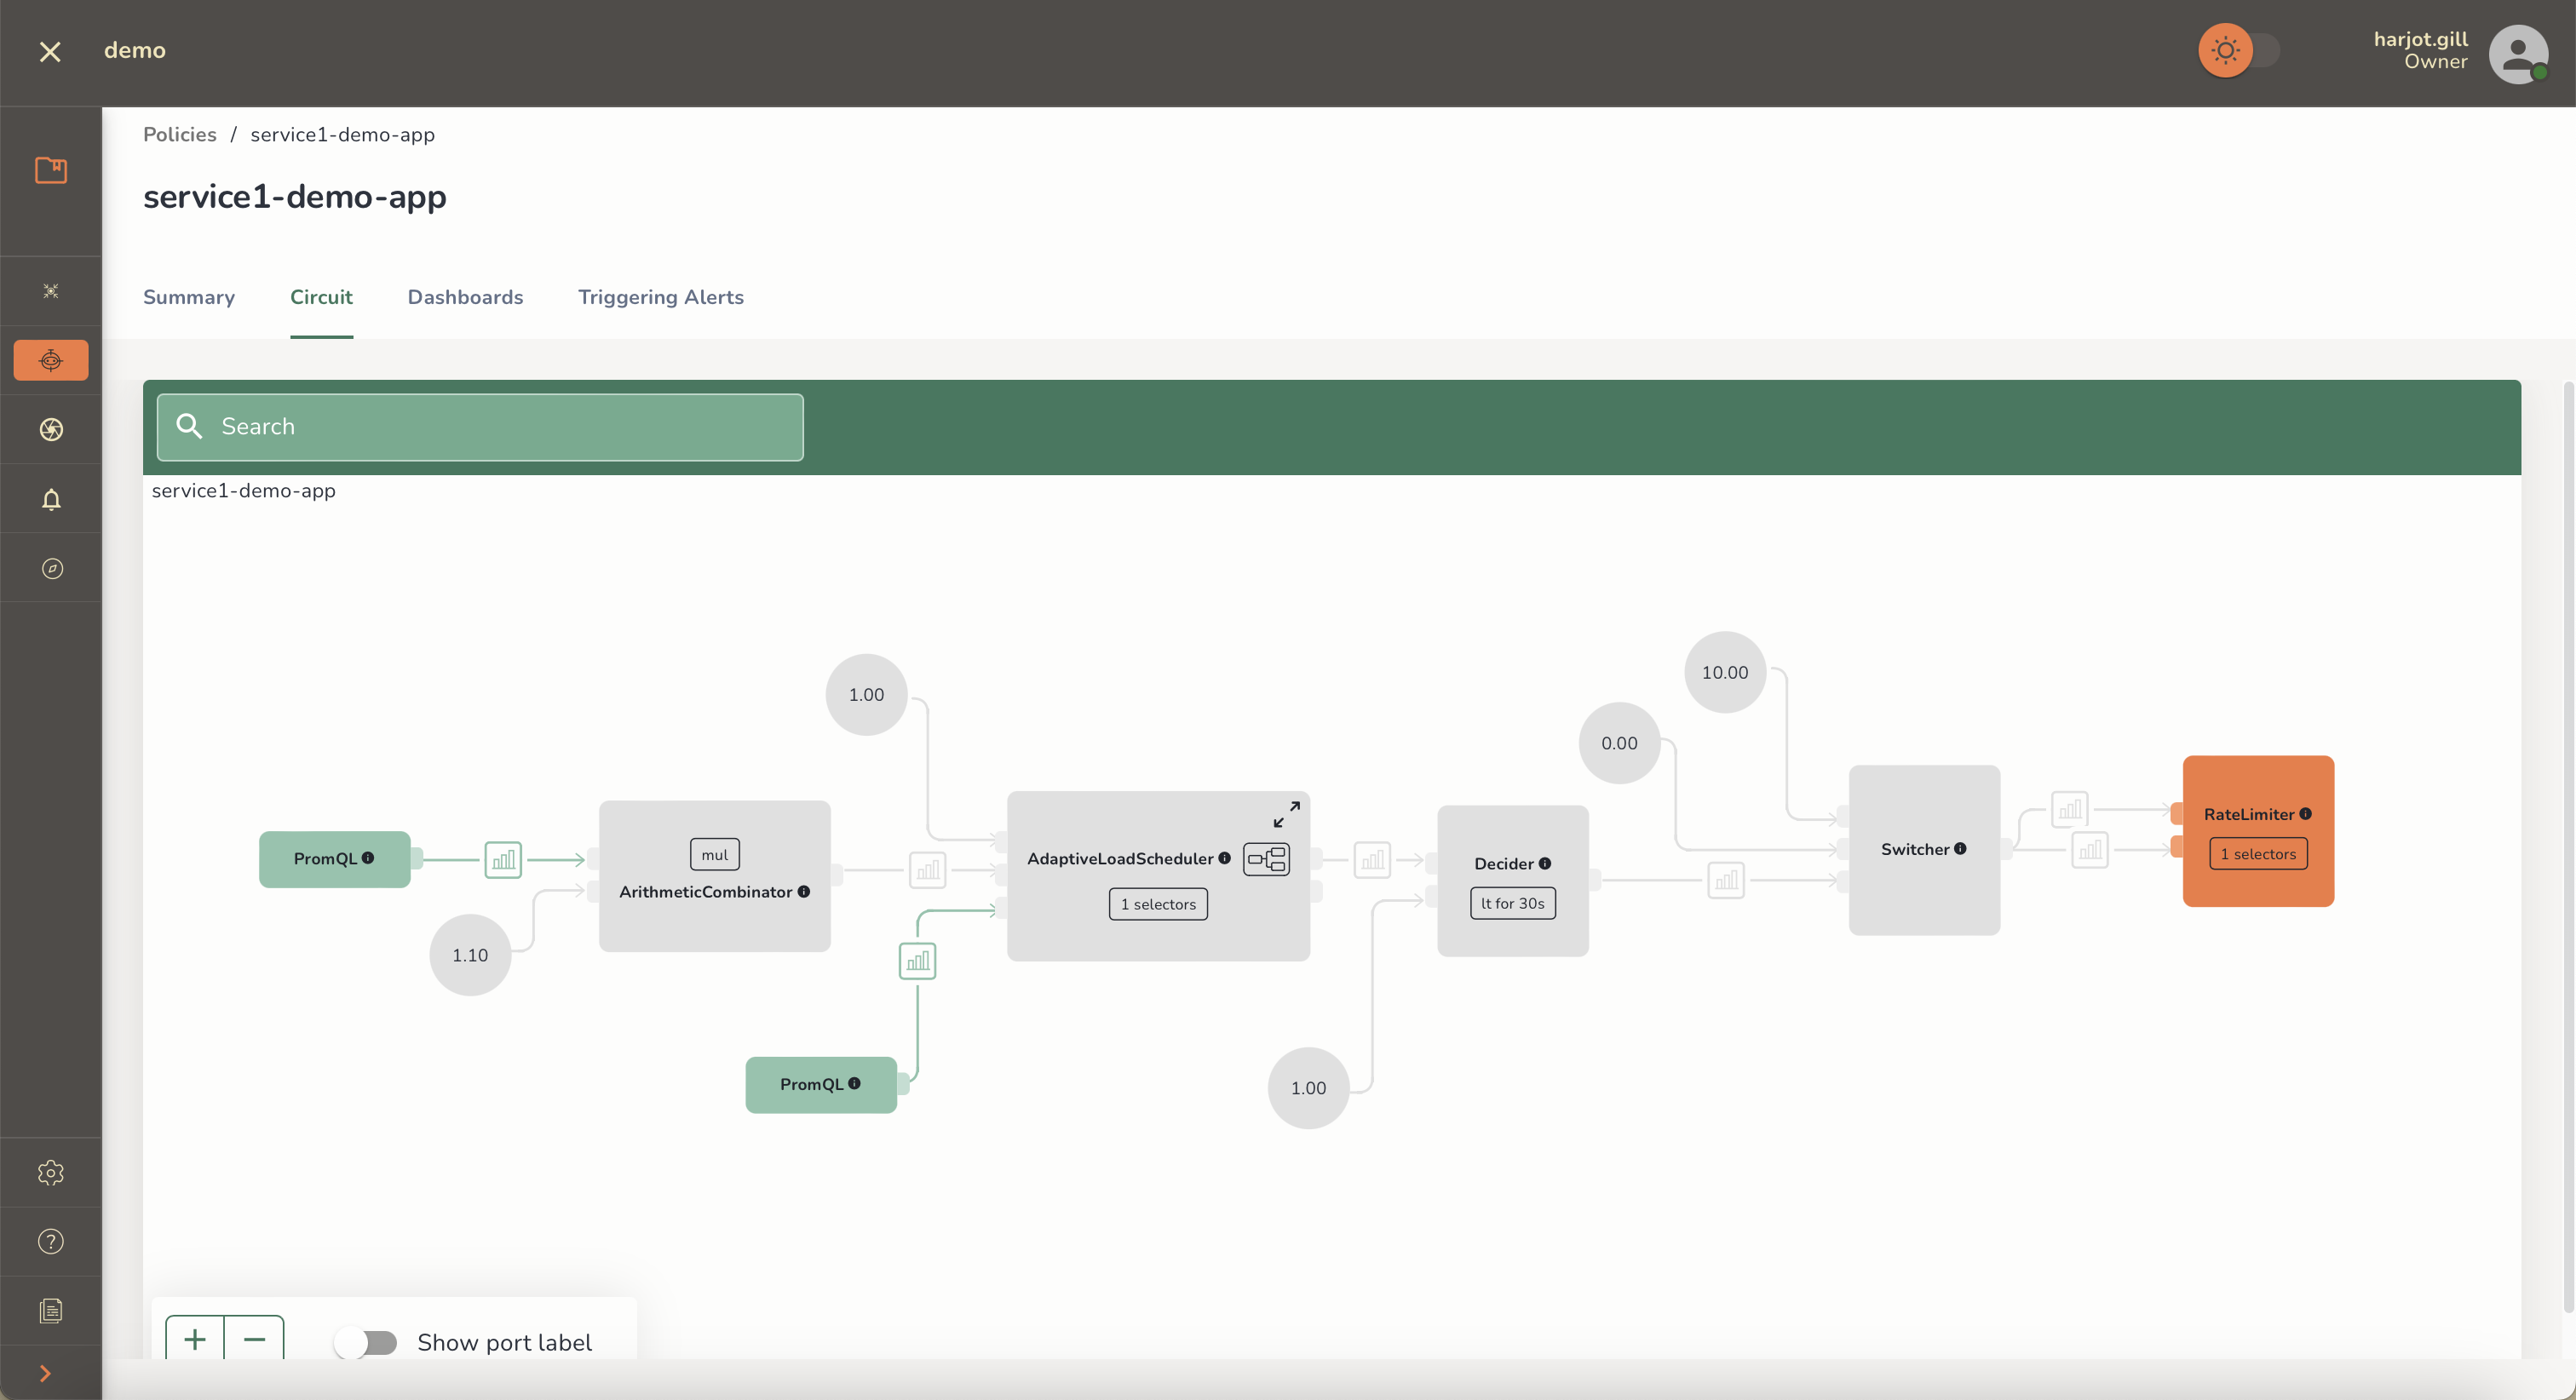
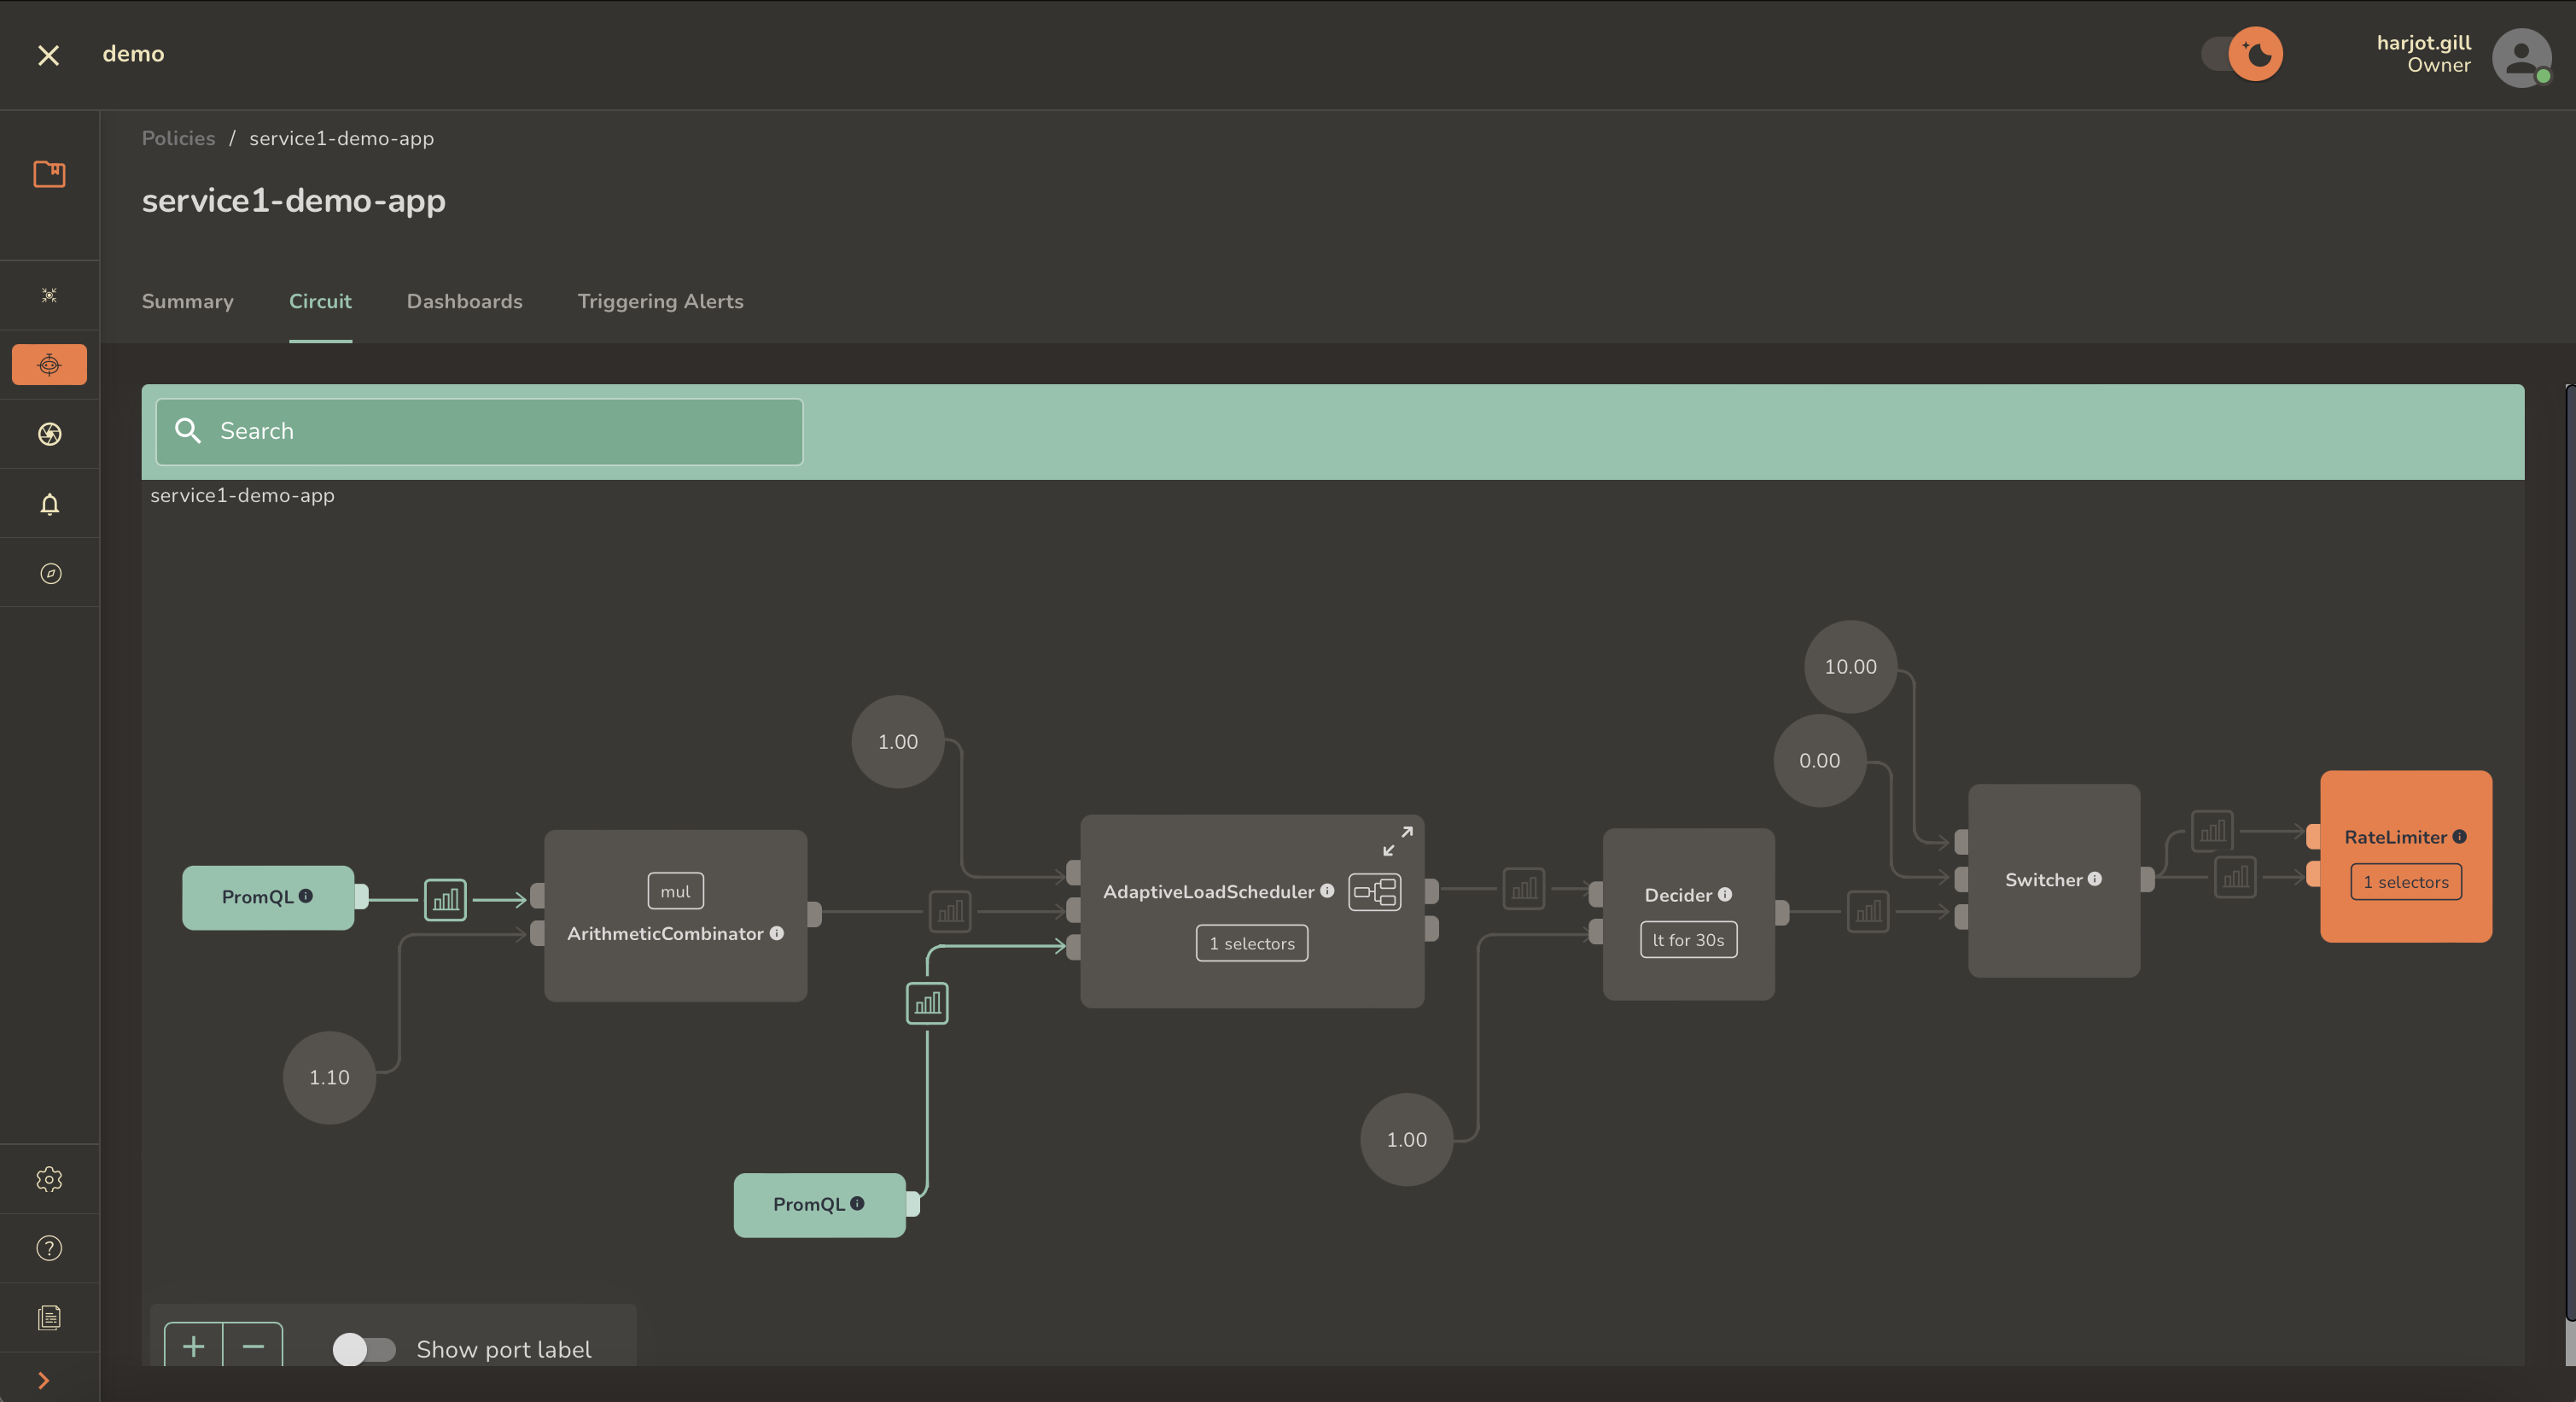 Aperture's policies are expressed as circuit graphs that continuously track
deviations from service-level objectives and calculate recovery or escalation
actions.
Aperture's policies are expressed as circuit graphs that continuously track
deviations from service-level objectives and calculate recovery or escalation
actions.
Our vision for the Aperture project is to build a unified control plane for cloud-native applications. We believe that control systems like load shedding and auto-scaling cannot exist isolated. They need to be unified into a single control plane and be aware of each other to ensure stable behavior. By taking an observability-driven approach, Aperture is well-positioned to provide a unified control plane that can be used to stabilize the entire application stack.
Conclusion
In this article, we have discussed how the industry has been focusing on observability alone to solve for reliability. SRE teams are stuck in a vicious cycle of firefighting while setting up even more monitoring and alerting, leading to fatigue and burnout. At the same time, the cost of observability is becoming unsustainable for many companies. It's a paradox that necessitates a new approach and a shift in the industry's trajectory, which, we believe, is controllability. We discussed the current state of controllability and how Aperture is bridging the controllability gap with a new class of control surfaces and an observability-driven control plane.
For a more in-depth understanding of Aperture, feel free to explore our Documentation and GitHub repository. Additionally, join our vibrant Discord community to discuss best practices, ask questions, and engage in insightful discussions with like-minded individuals.
The open source core offering is augmented by the commercial Aperture Cloud SaaS product that offers a managed control plane, advanced traffic analytics, policy management and so on.
 Aperture Cloud provides in-depth insights into the traffic patterns to help
tailor policies that prioritize critical requests.
Aperture Cloud provides in-depth insights into the traffic patterns to help
tailor policies that prioritize critical requests.
 Aperture Cloud actively monitors and visualizes control policies, providing
real-time explanations for actions taken from health signals.
Aperture Cloud actively monitors and visualizes control policies, providing
real-time explanations for actions taken from health signals.